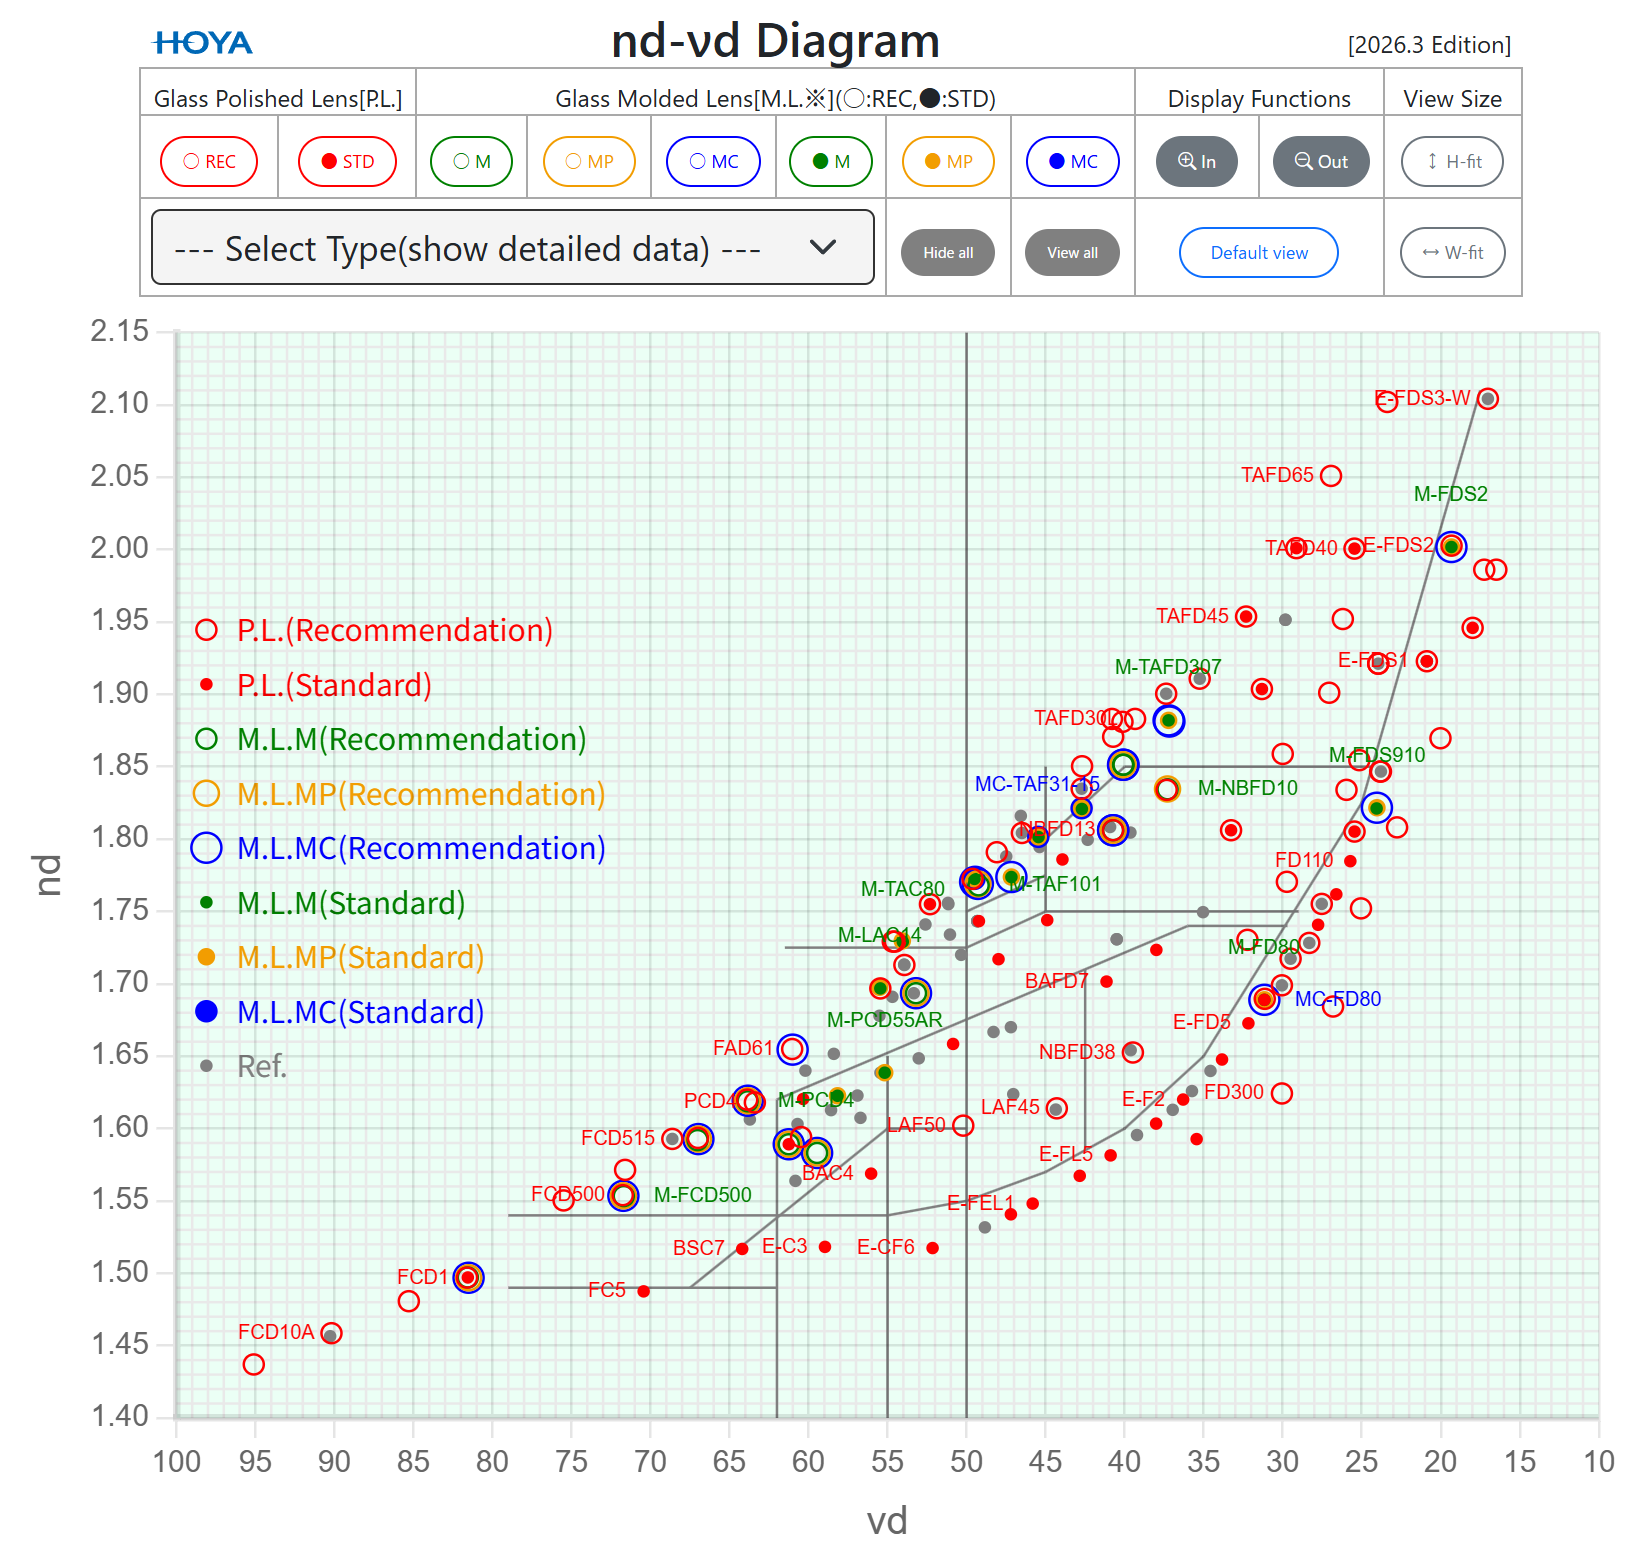
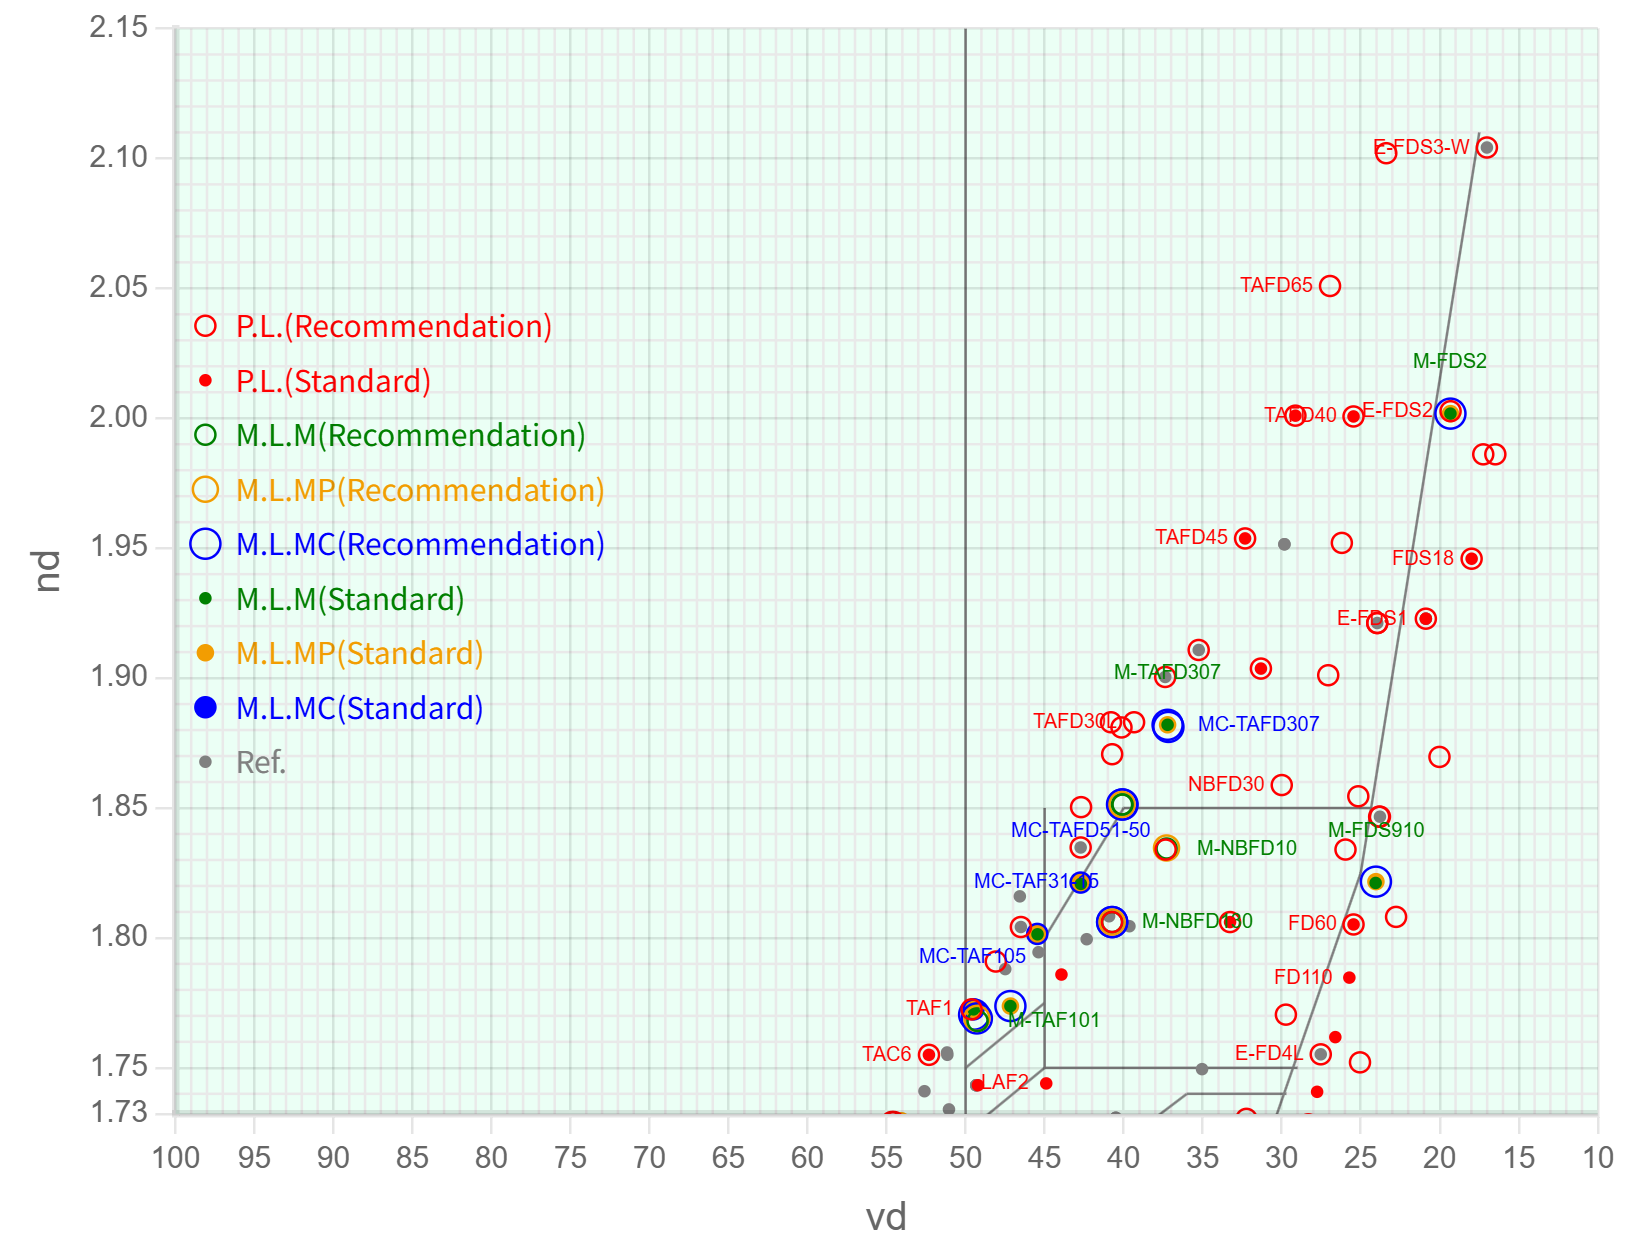
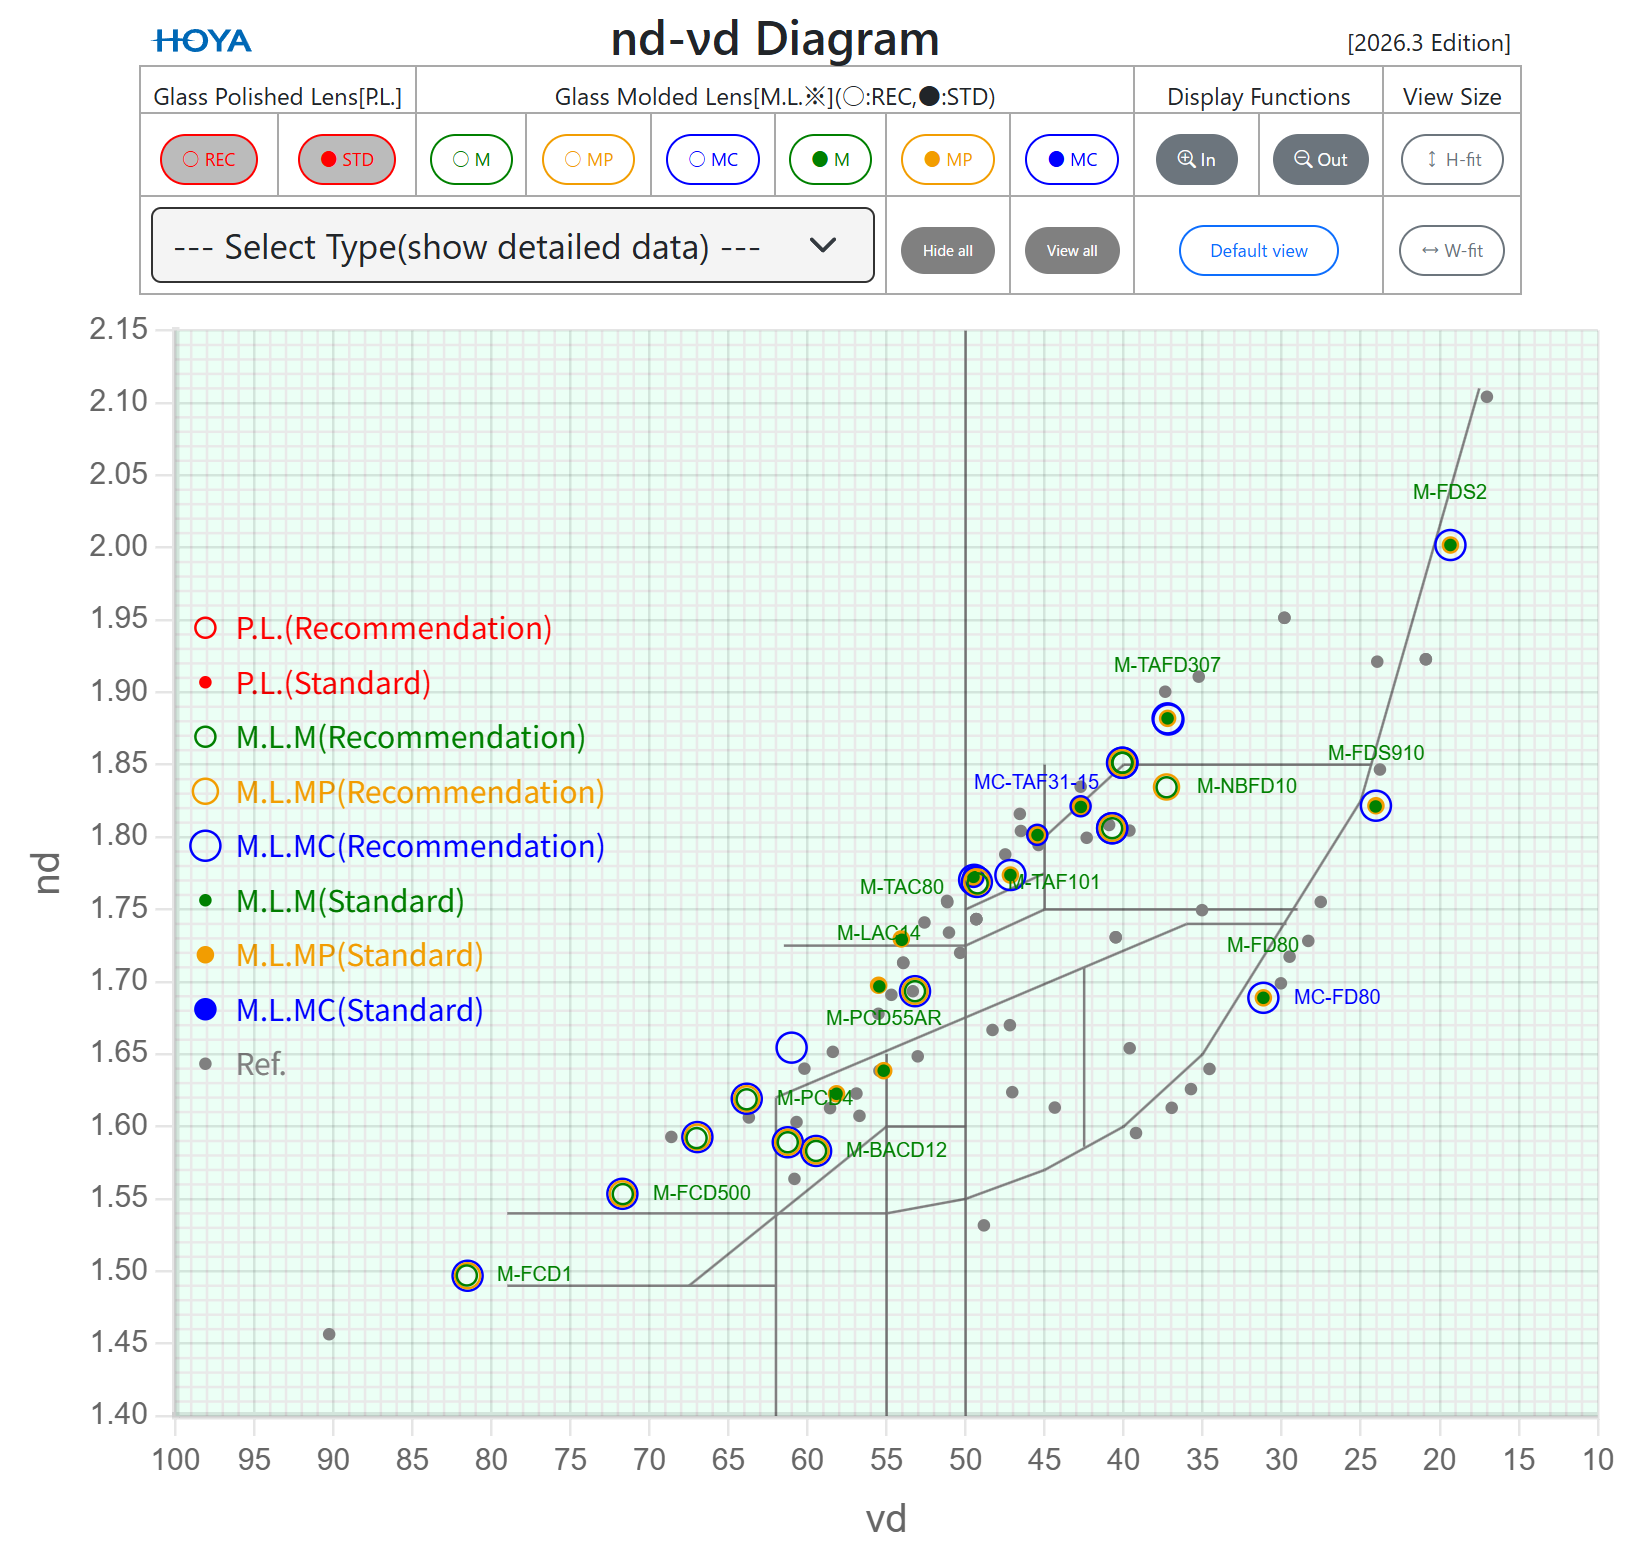
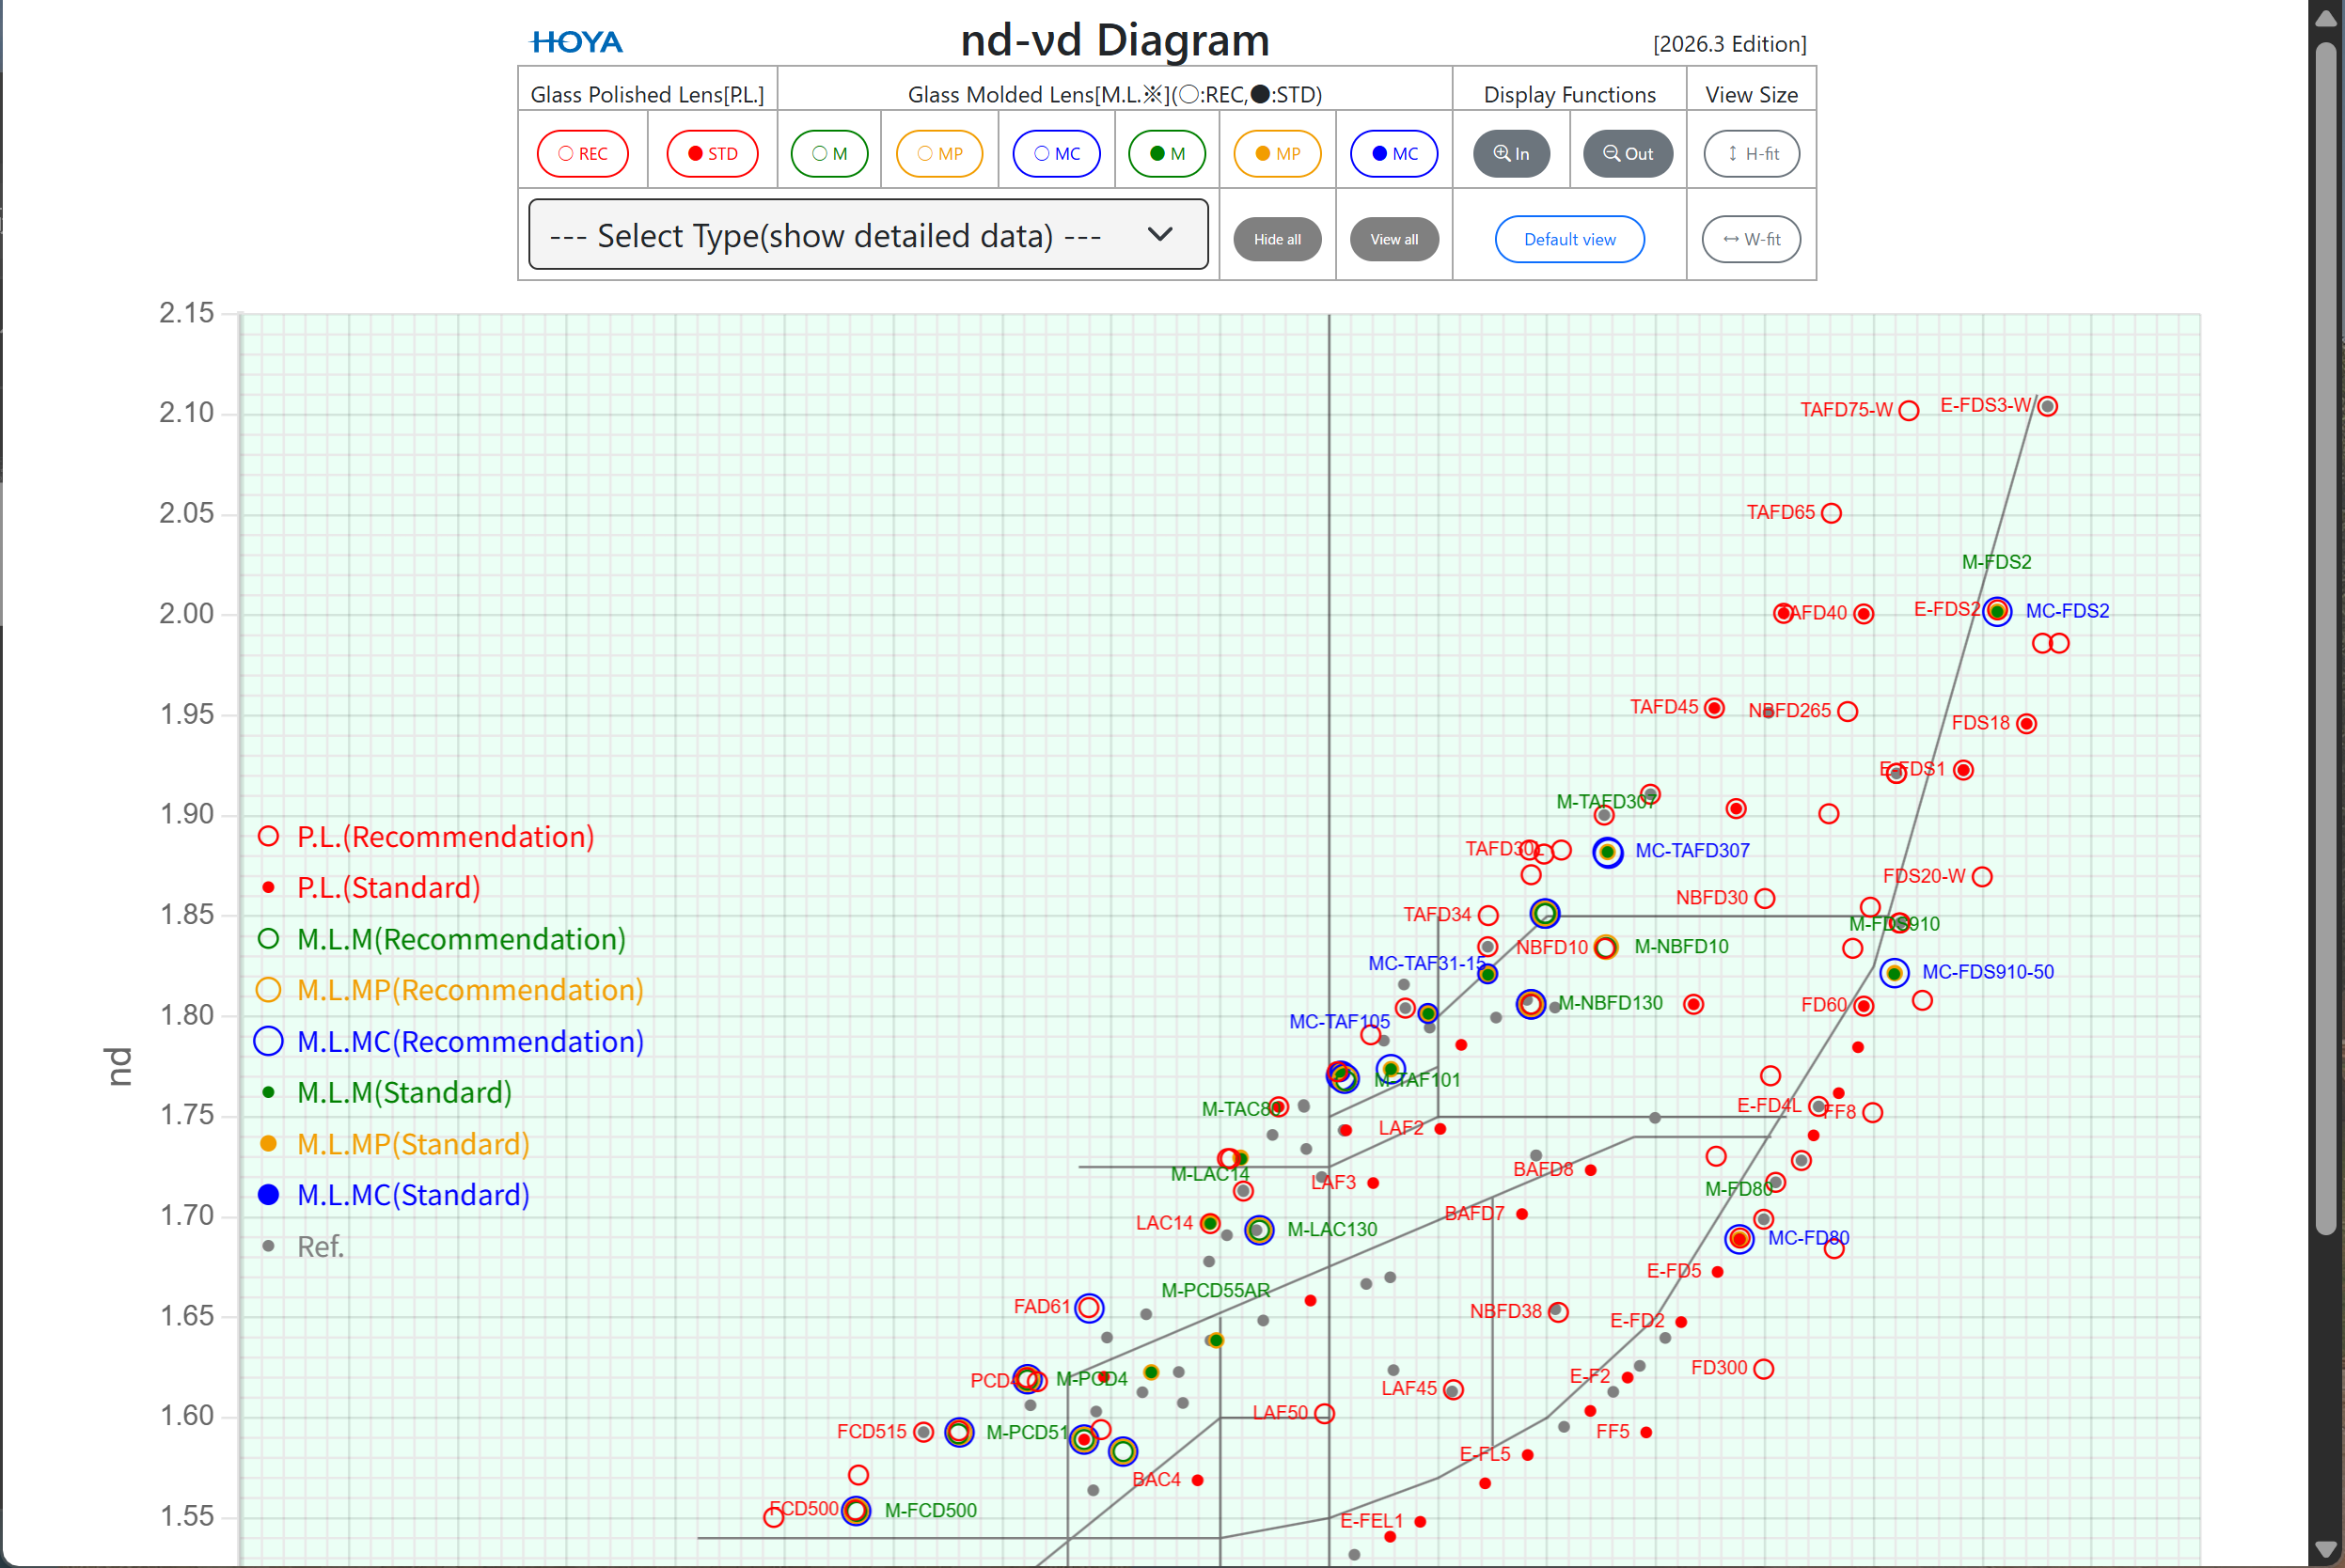
This manual explains the screen layout, the functions and the operating methods using nd-νd diagram as an example (Fig.1).
*) If the figure is too small to see clearly, click on it to enlarge it.
This website can be used regardless of your computer's operating system (e.g., Windows, macOS and Linux) or browser (e.g., Chrome, Firefox, Edge and Safari), whether it's desktop and laptop computers, tablet or smartphone and so on.
However, it is intended for use on personal computers, and some functions including pop-up may be limited depending on the environment.
The recommended environment is as follows:
■OS: Microsoft Windows
■Browser: Google Chrome, Microsoft Edge
■JavaScript: Active
■Display resolution: 1920x1080 or higher
This diagram can not only visualize the characteristic values of different glass types, allowing for a visual comparison of them, also it has a function to display detailed characteristic values (PDF) for each glass type.
This diagram operations can be performed intuitively using the mouse, moreover, the size of characteristic diagram is responsive to the screen size of the viewing device.
Five diagrams are prepared in order to use the one suitable for customer needs.
(1) nd-νd Diagram
(2) nd-1/νd Diagram
(3) HK-FA Diagram
(4) PgF-νd Diagram
(5) Pct-νd Diagram
This screen consists of the command table section (Fig.2) for operating the diagram and the diagram section (Fig.3) where the characteristic values of each glass type are displayed as a scatter plot.
See “Chapter 3. Functions and Operating methods” for details on the functions of each section.
This section explains the functions and the operating methods of the diagram. To ensure a smooth explanation, the diagram section (Fig.3) will be described at first, and then introduce the command table section (Fig.2).
On the other hand, pinch gestures are used on tablets and smartphones. This will be explained “Chapter 5”.
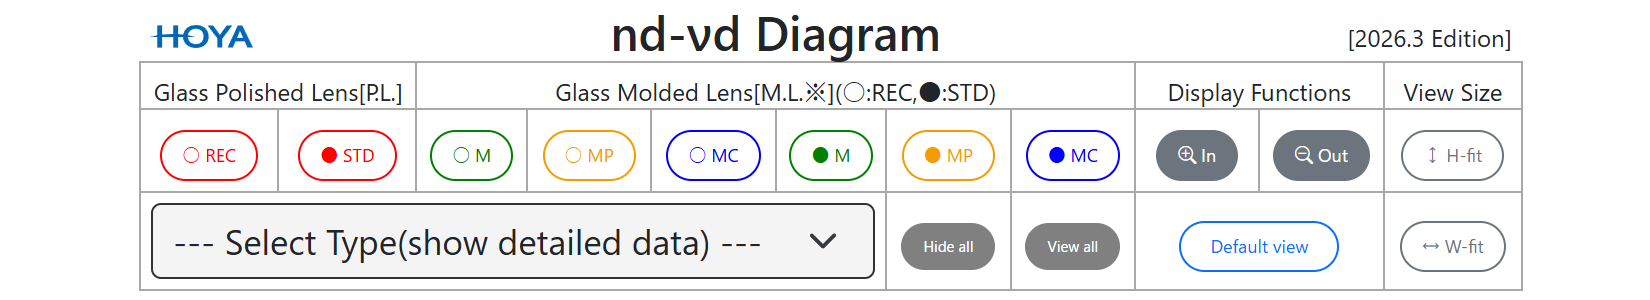
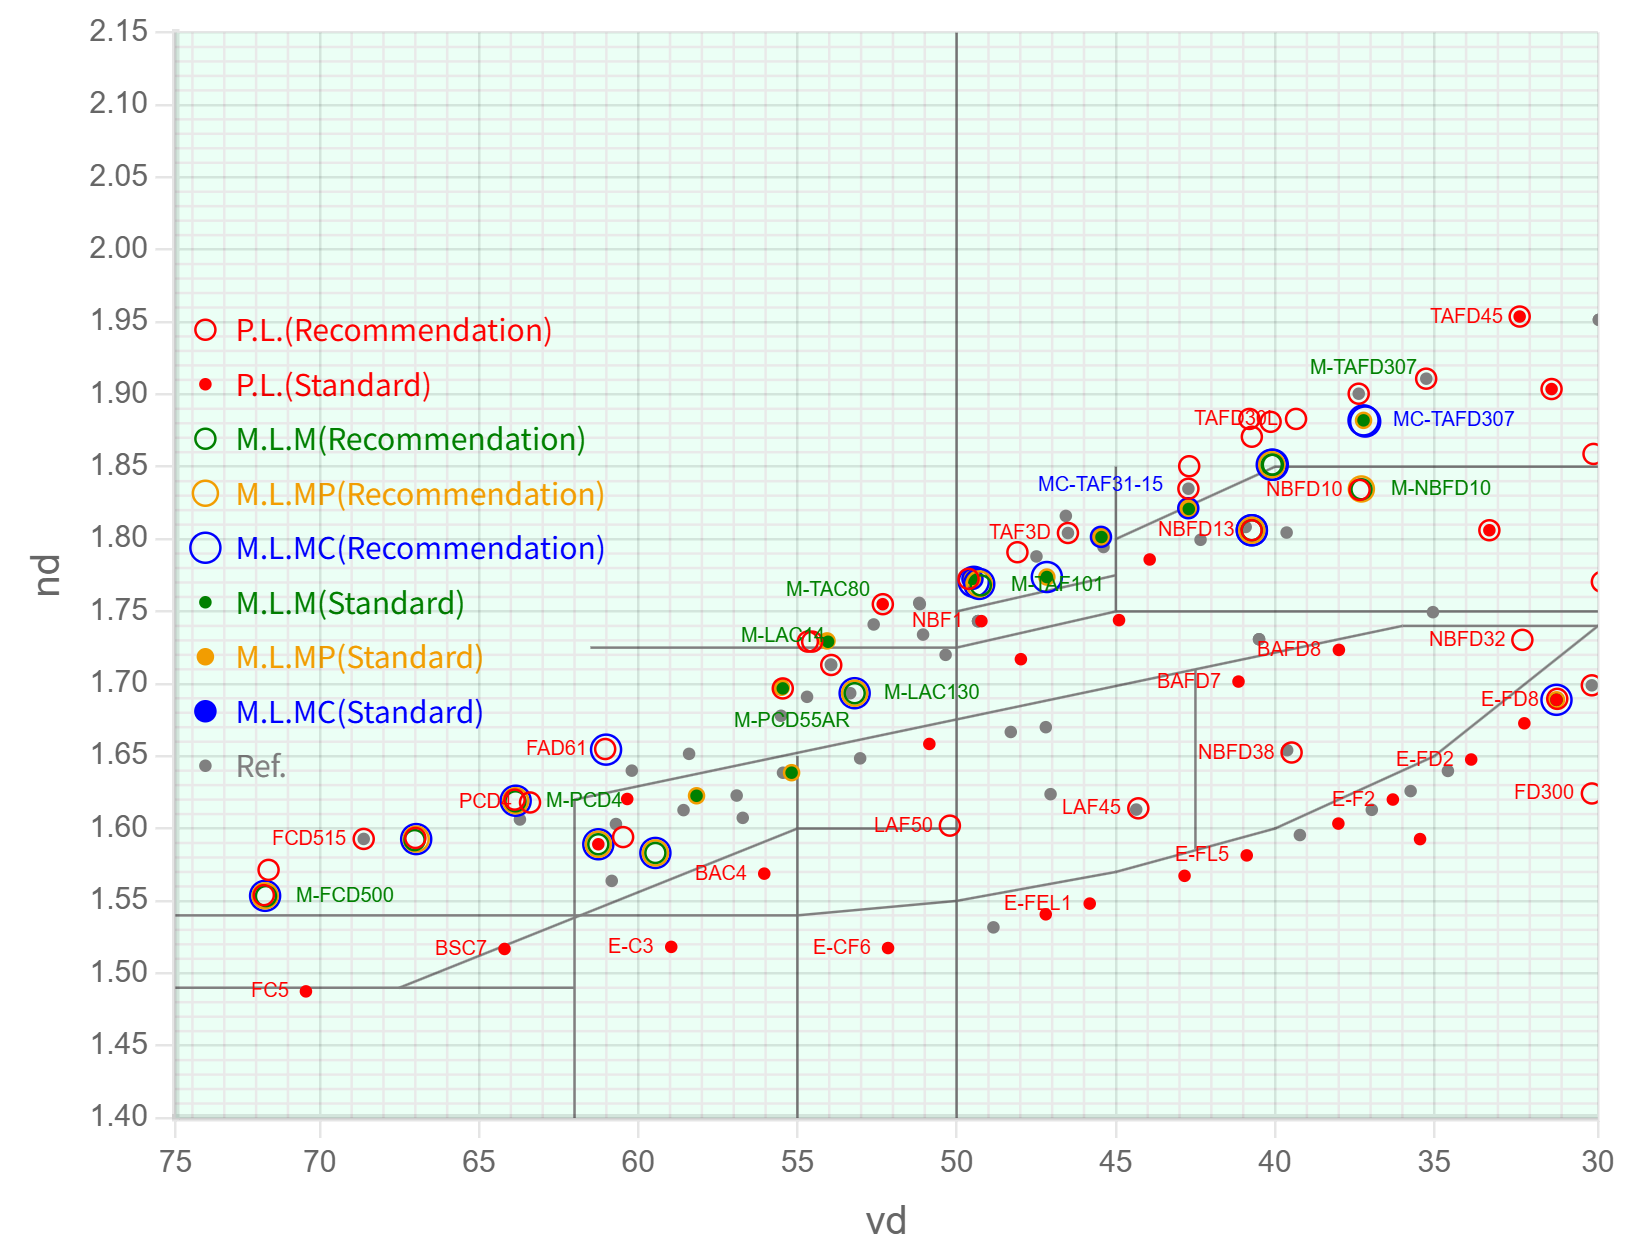
The diagram section displays points with glass type (it refers to glass name), a legend and grid lines for the vertical and horizontal axes. Due to the high density of points, glass types are only displayed where they do not overlap with each other.
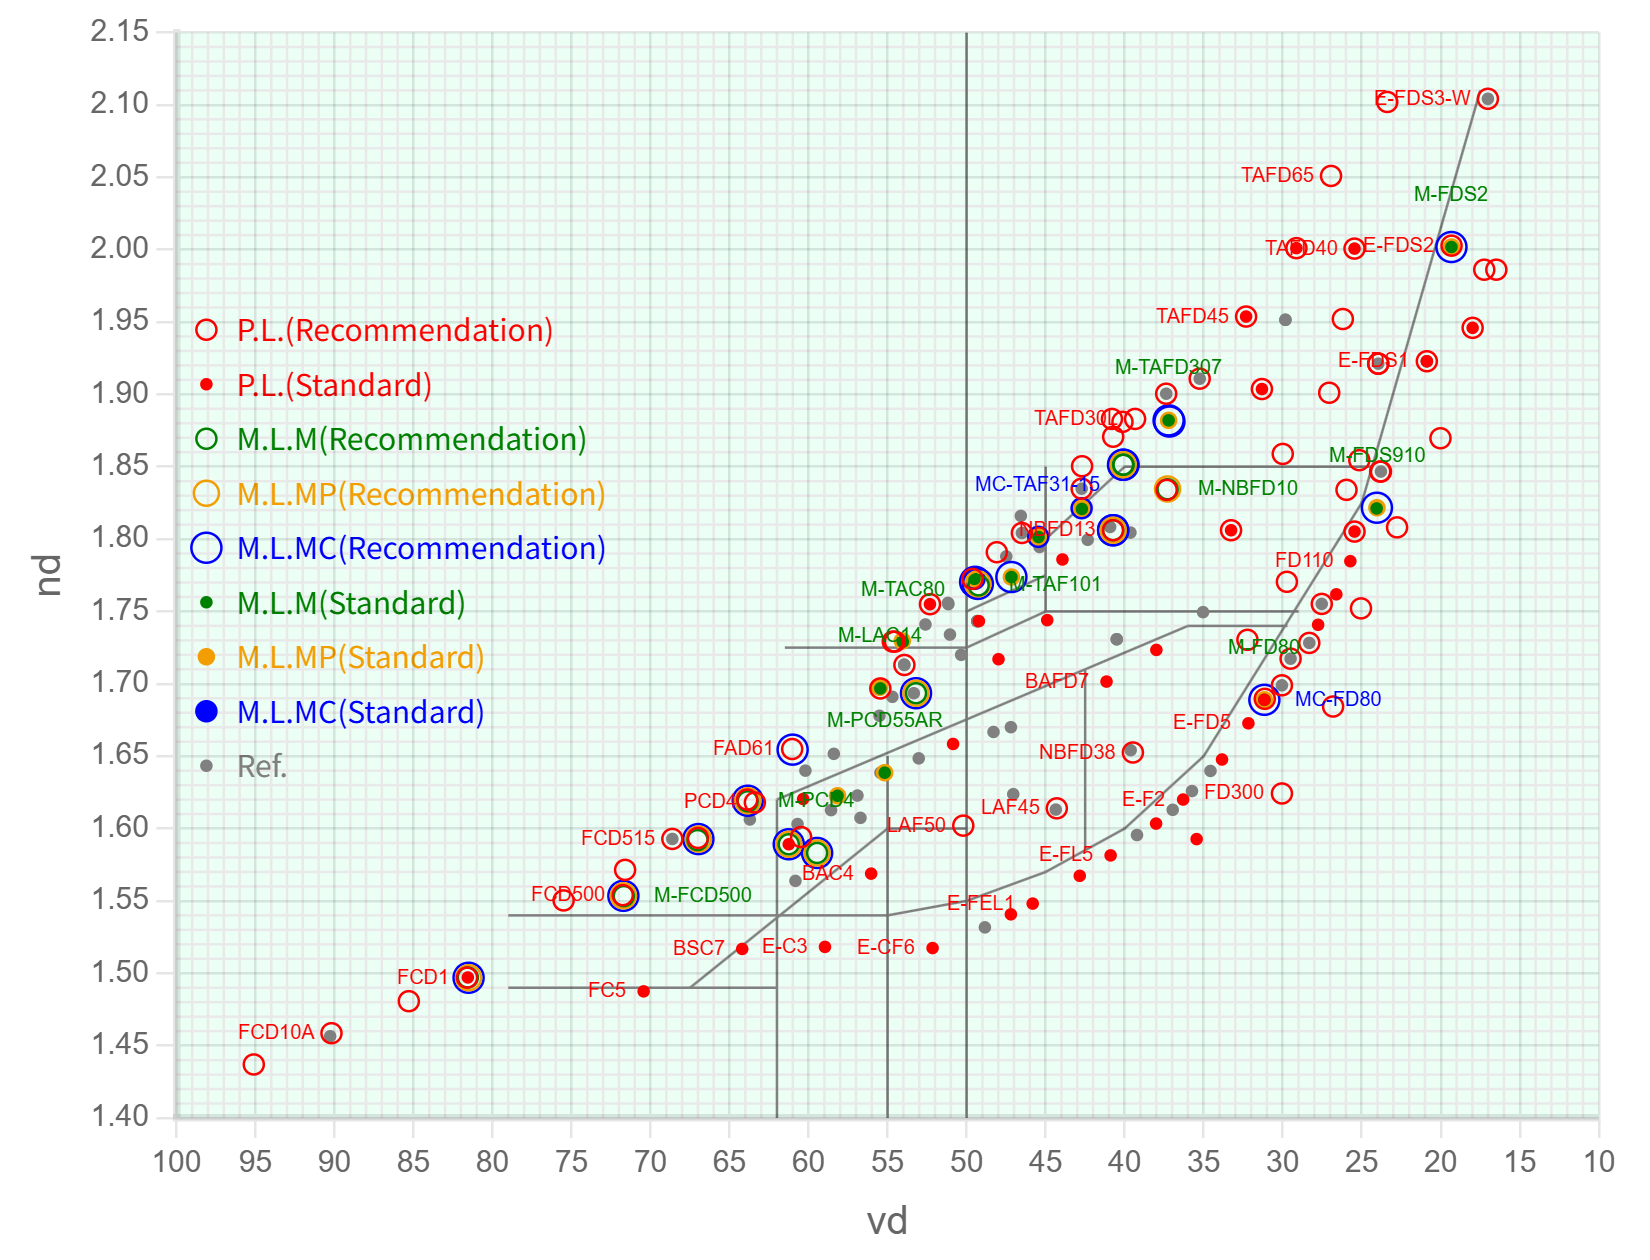
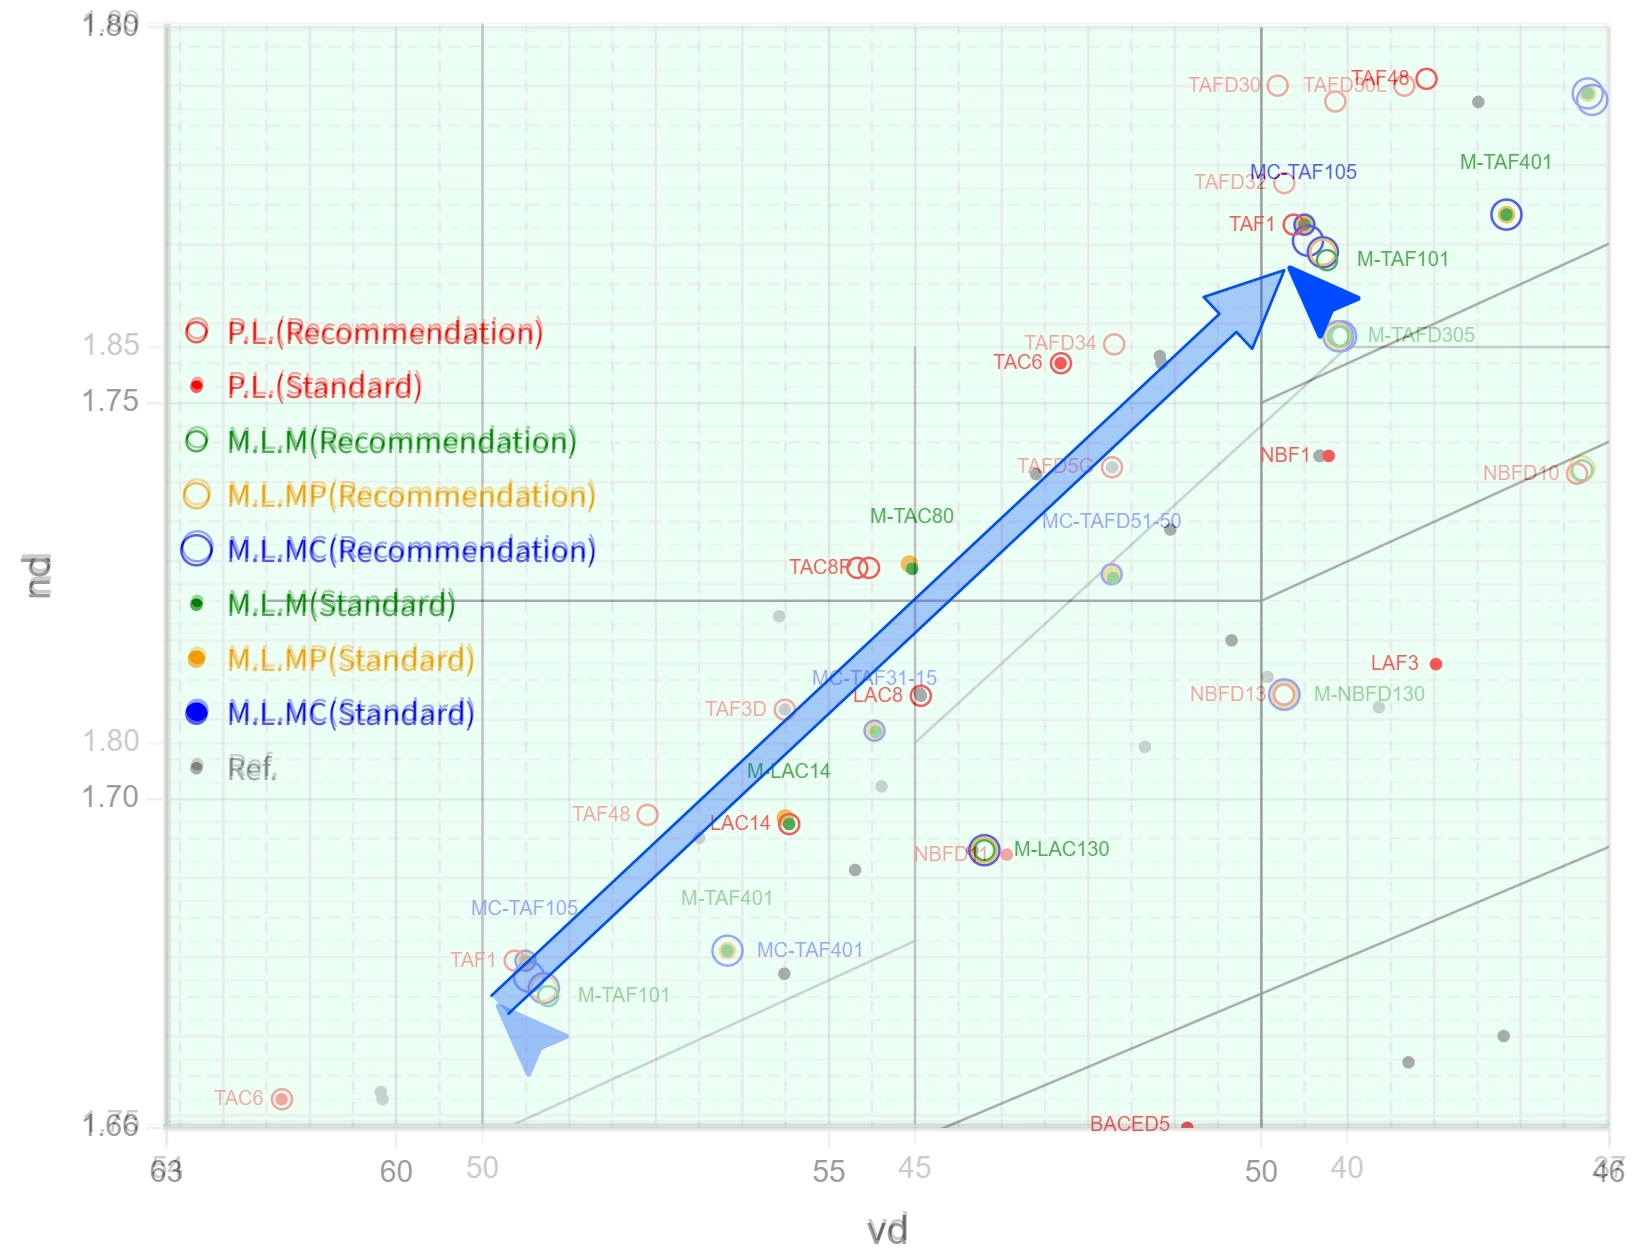
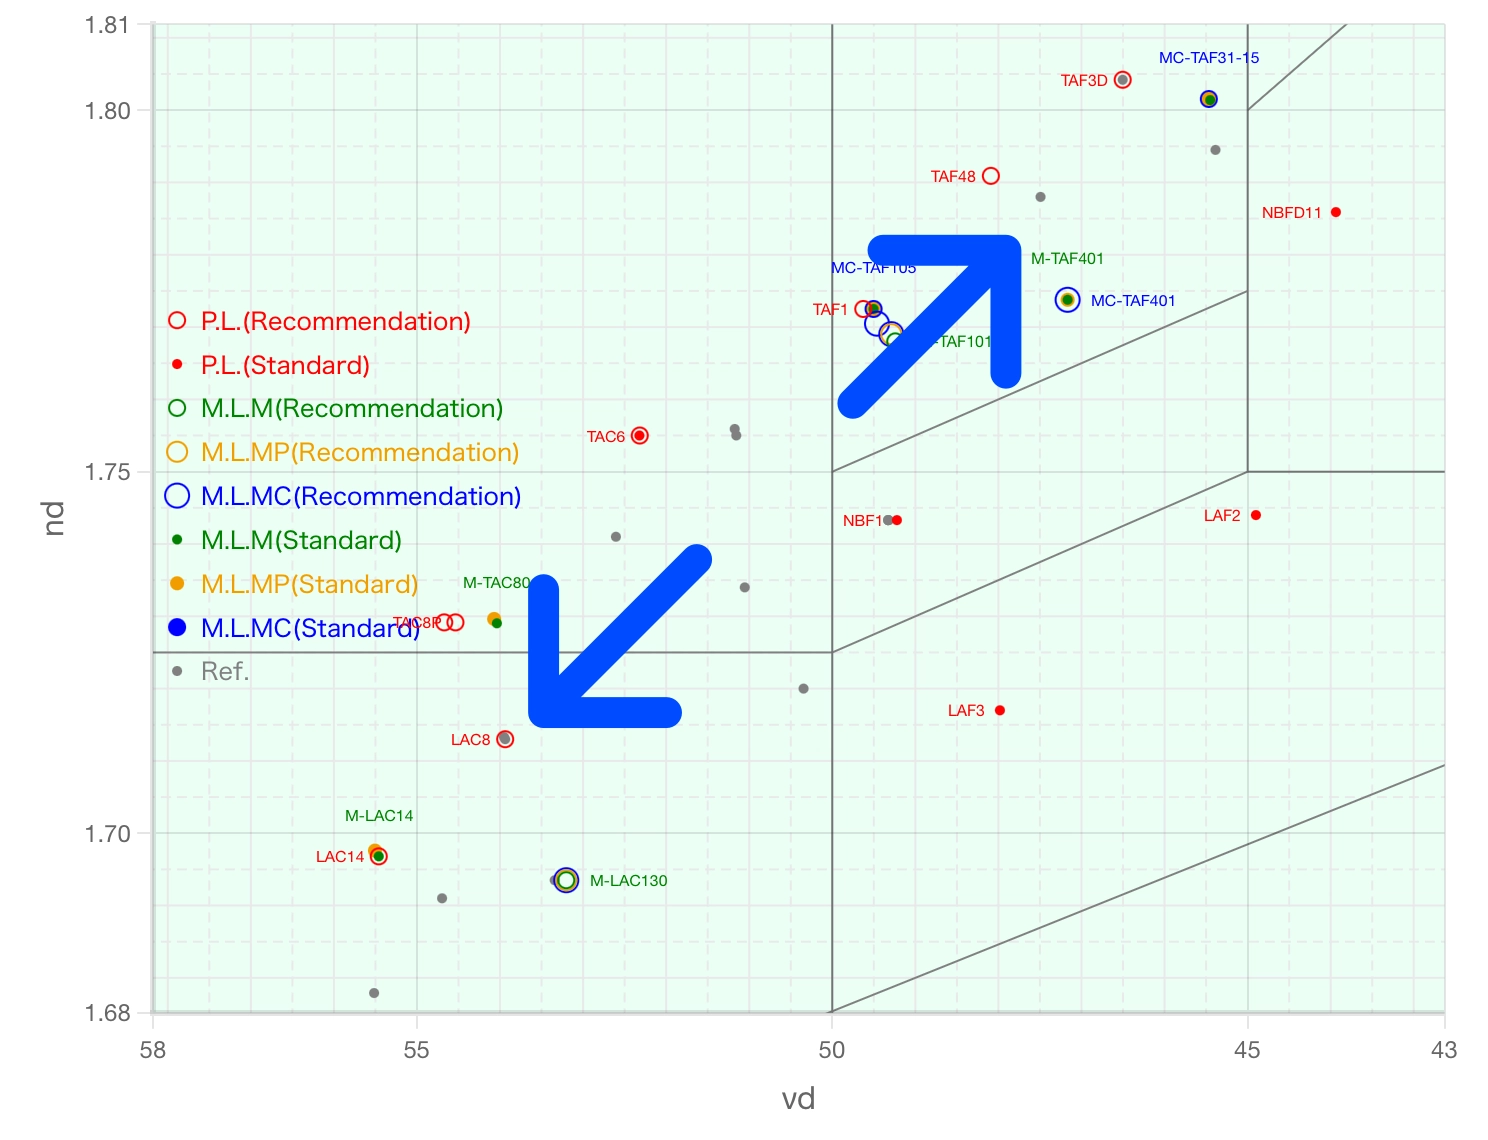
To enlarge diagram (Fig.4):
Step 1 Place the mouse cursor within the diagram section.
Step 2 The diagram will be enlarged relative to the mouse cursor's position, so move the cursor to the point of the diagram you want to enlarge.
Step 3 Rotate the mouse wheel forward.
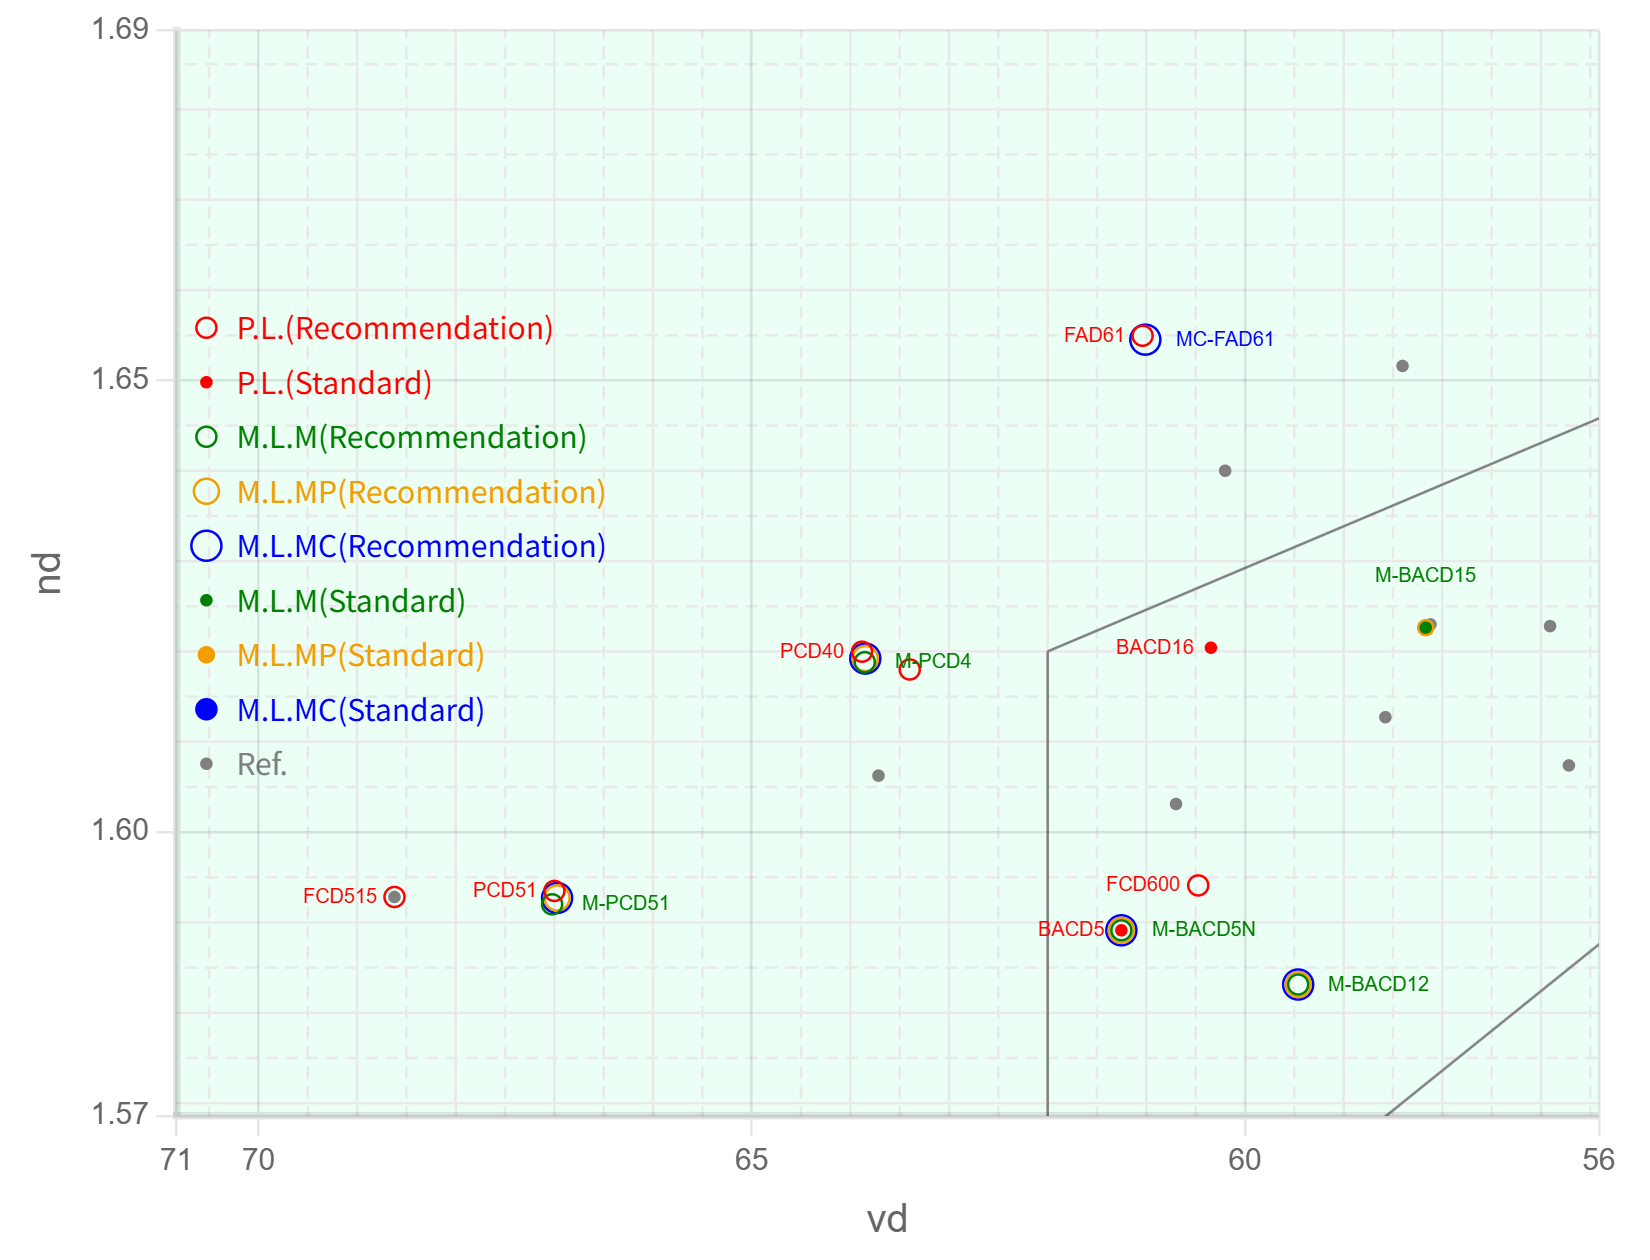
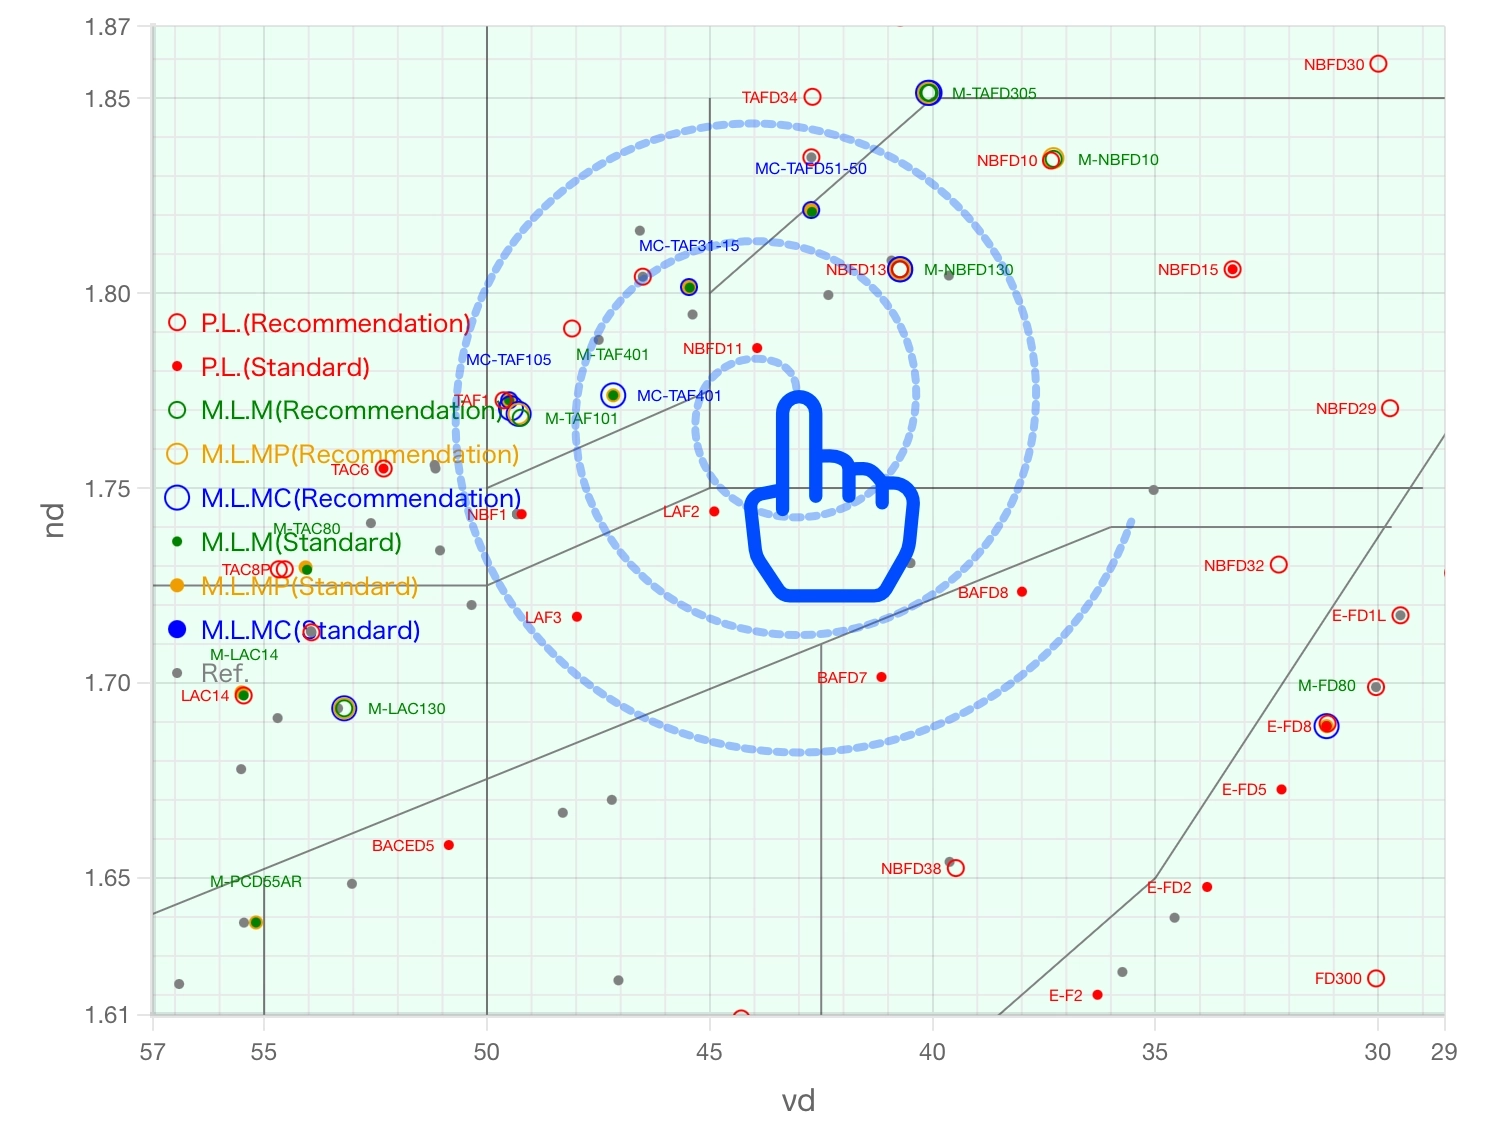
*) When the zoom level exceeds 4x, the guide lines appear as dashed lines between small tick marks, as shown in Fig.5.
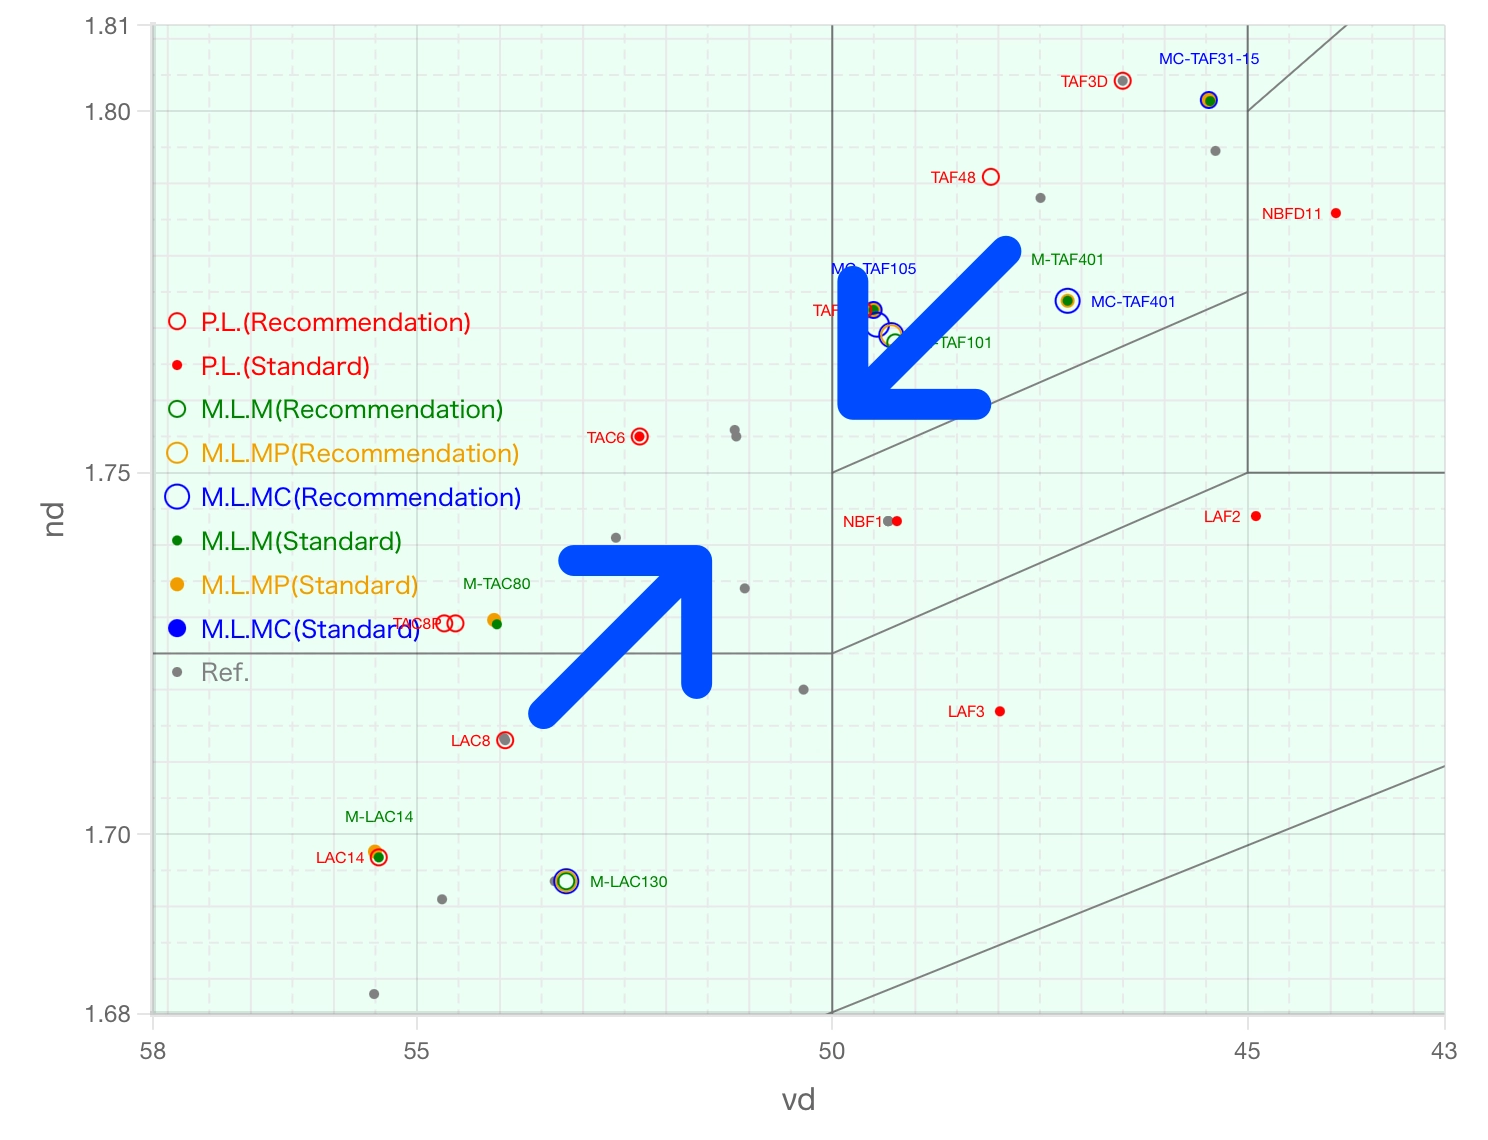
To reduce diagram:
Until same Step 1 and 2 of the enlarging method, but in Step 3, rotate the mouse wheel backward.
The functions of enlarging/reducing diagram maintain a constant aspect ratio for both the vertical and horizontal axes, but this diagram section also includes special functions that allows to enlarge for either the vertical or horizontal axis.
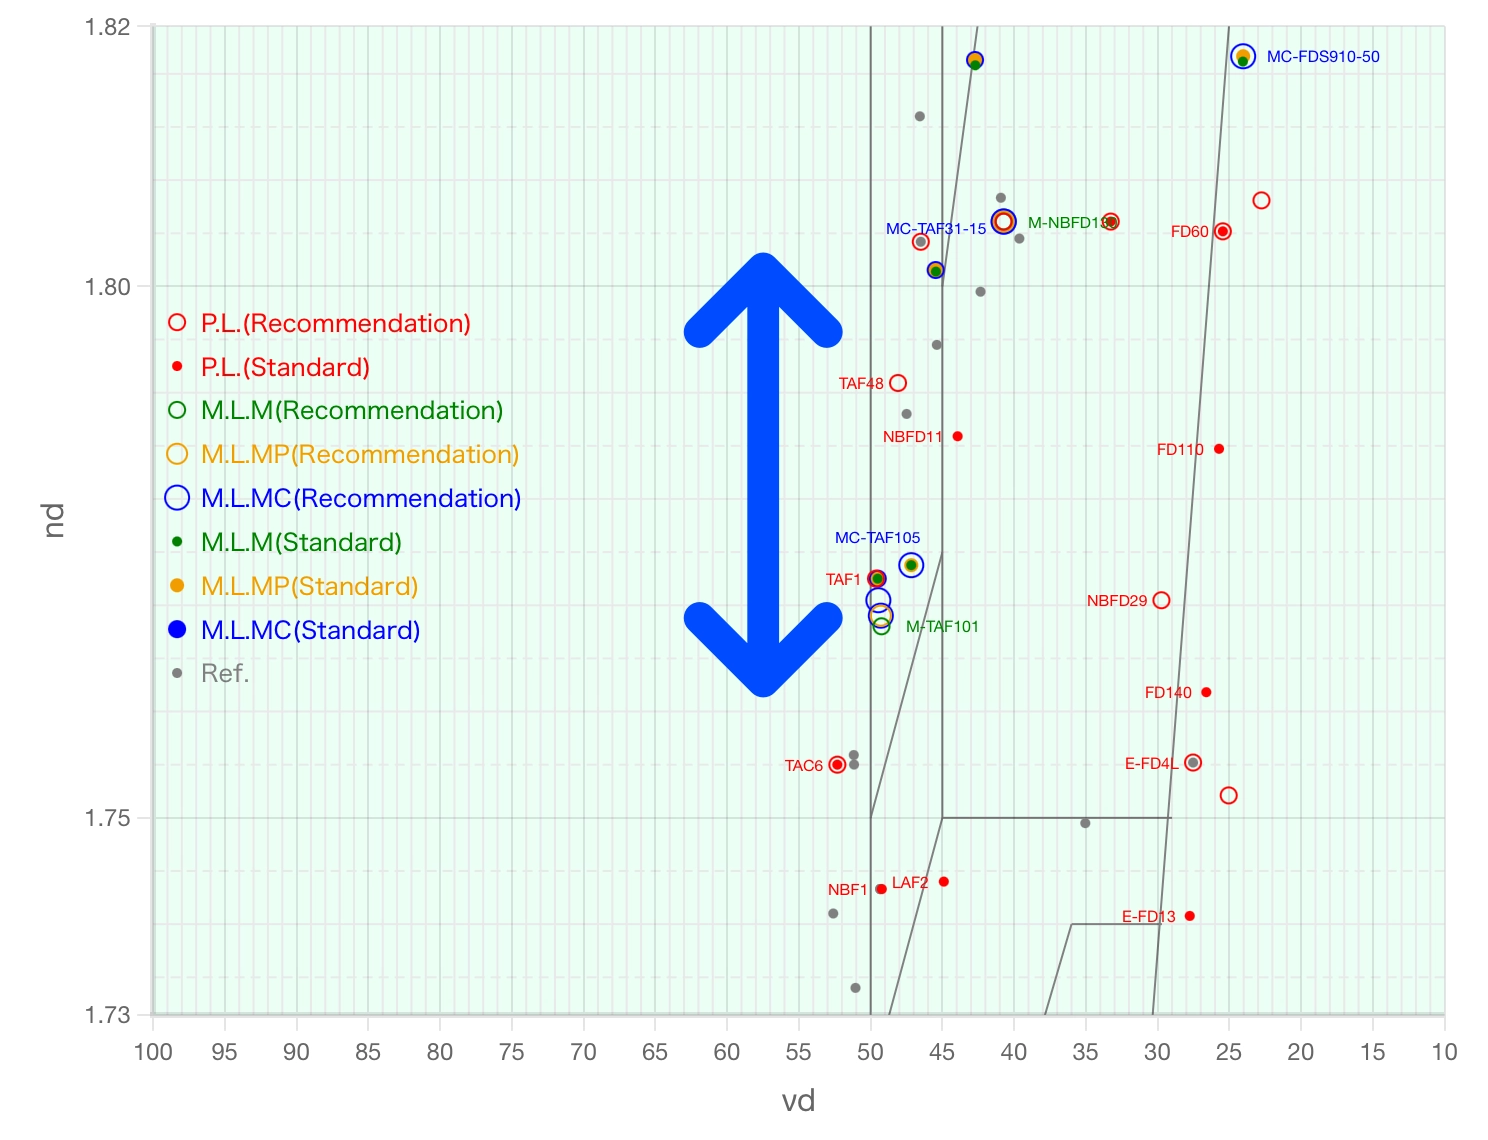
For example, when the diagram section is at the default view as shown in Fig.3, if the mouse cursor hovers the horizontal major tick mark or axis label and rotate the mouse wheel backward then the spacing between the vertical axis lines will widen (Fig.6).
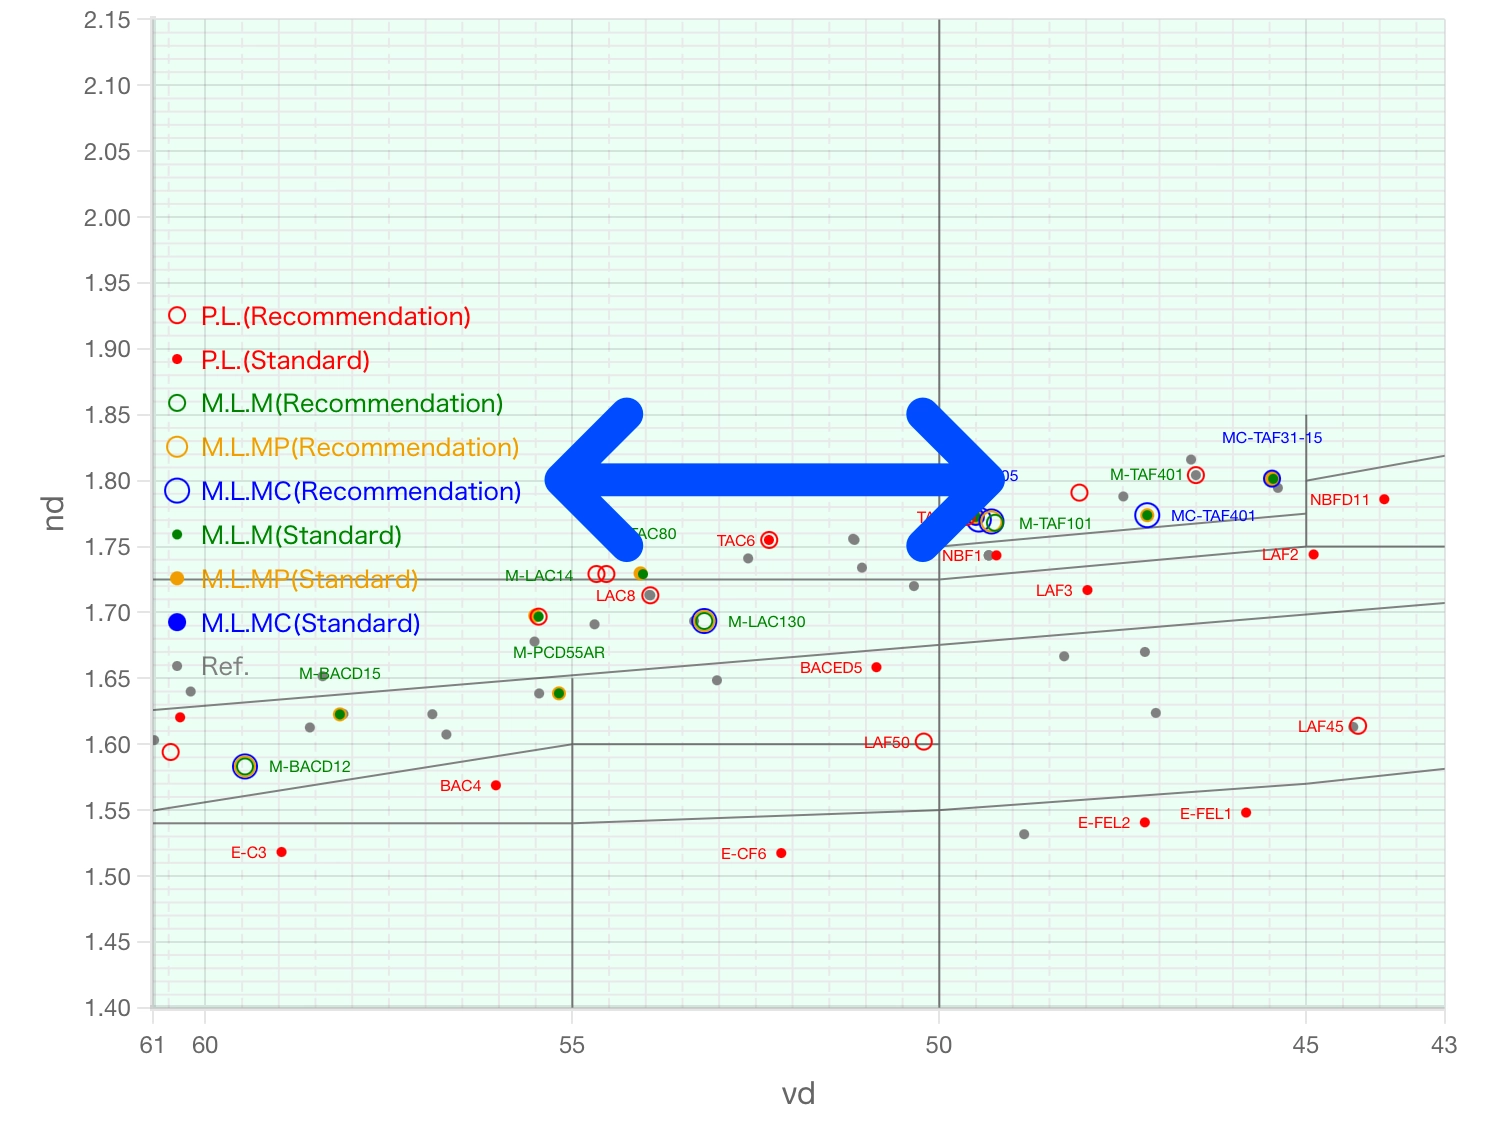
Similarly, to widen the spacing of the horizontal axis lines, place the mouse cursor over the vertical axis tick mark or axis label in the diagram section displayed in the default view, and then rotate the mouse wheel backward (Fig.7).
As shown in Fig.8,
Step 1 Place the mouse cursor within the diagram section.
Step 2 The diagram will move according to the mouse cursor's position, so move the cursor to the point of the diagram you want to move.
Step 3 Click and hold the left mouse button and move the mouse, the diagram will move along with it.
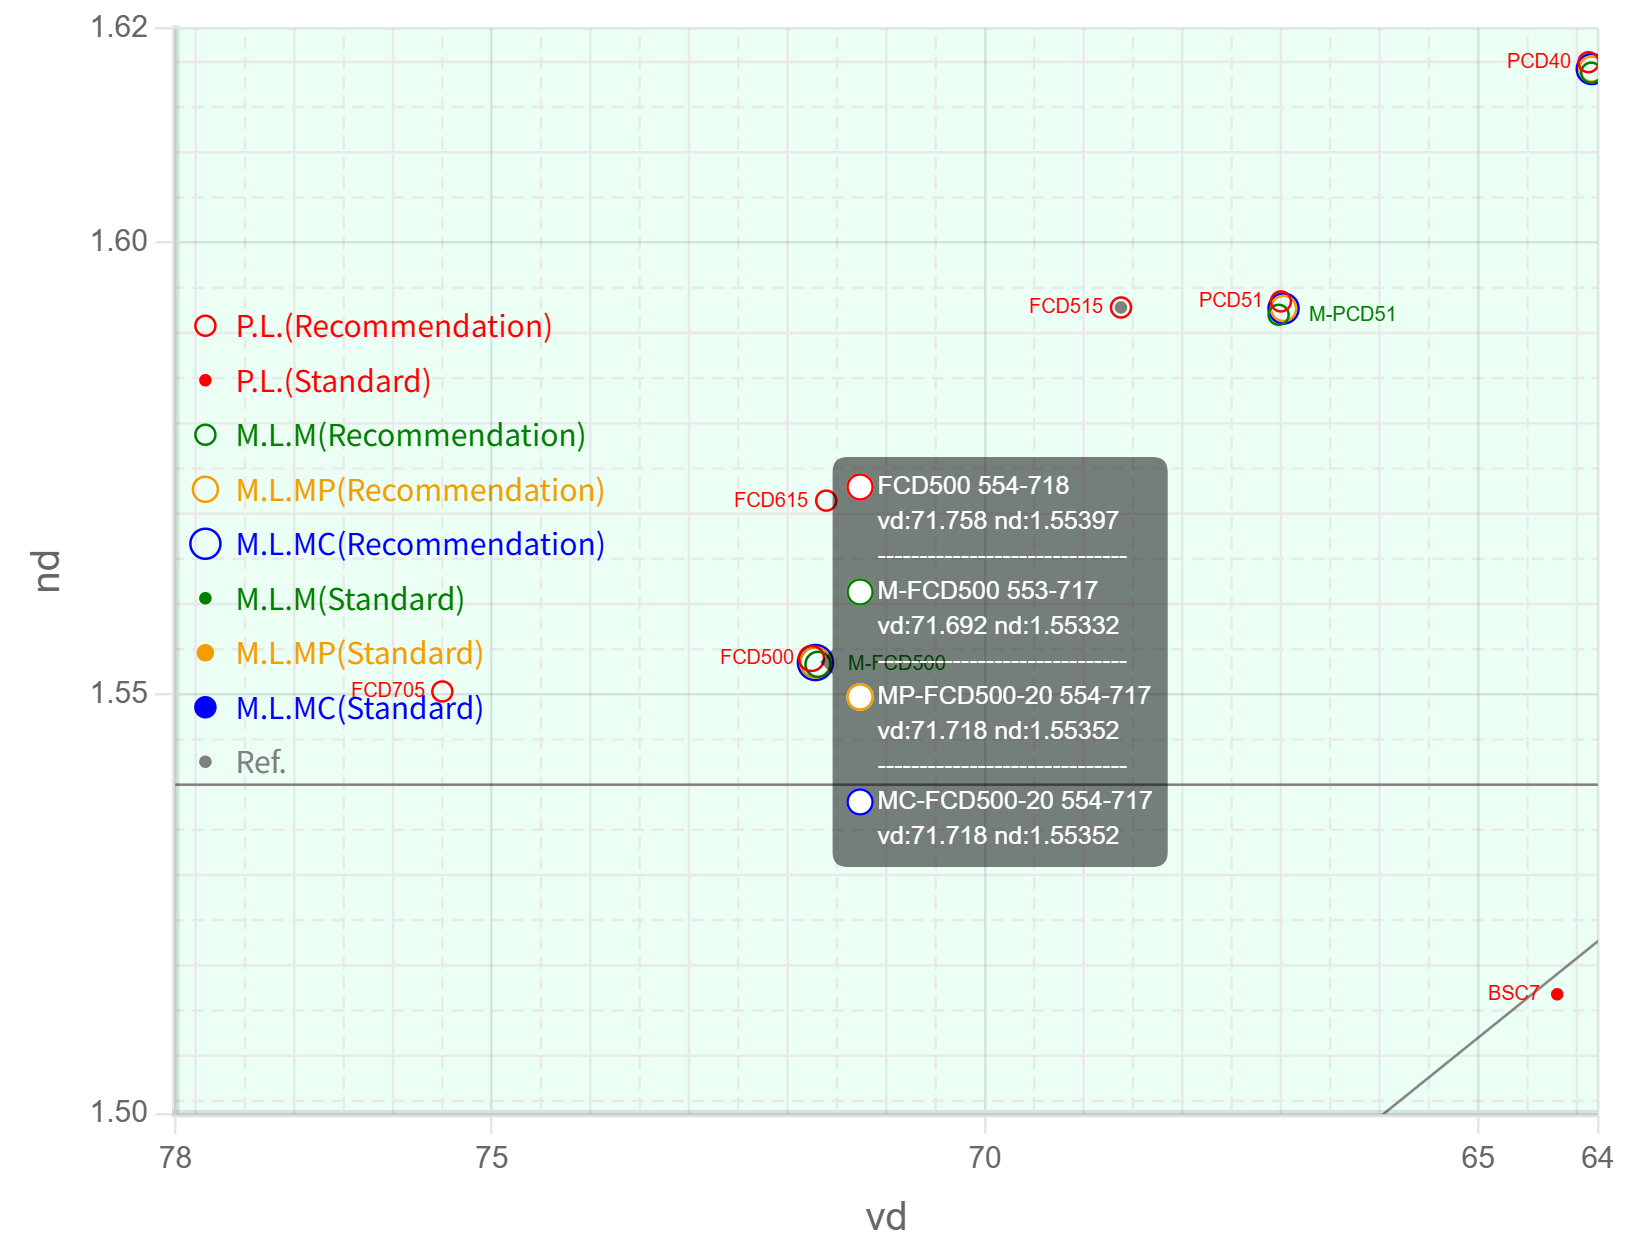
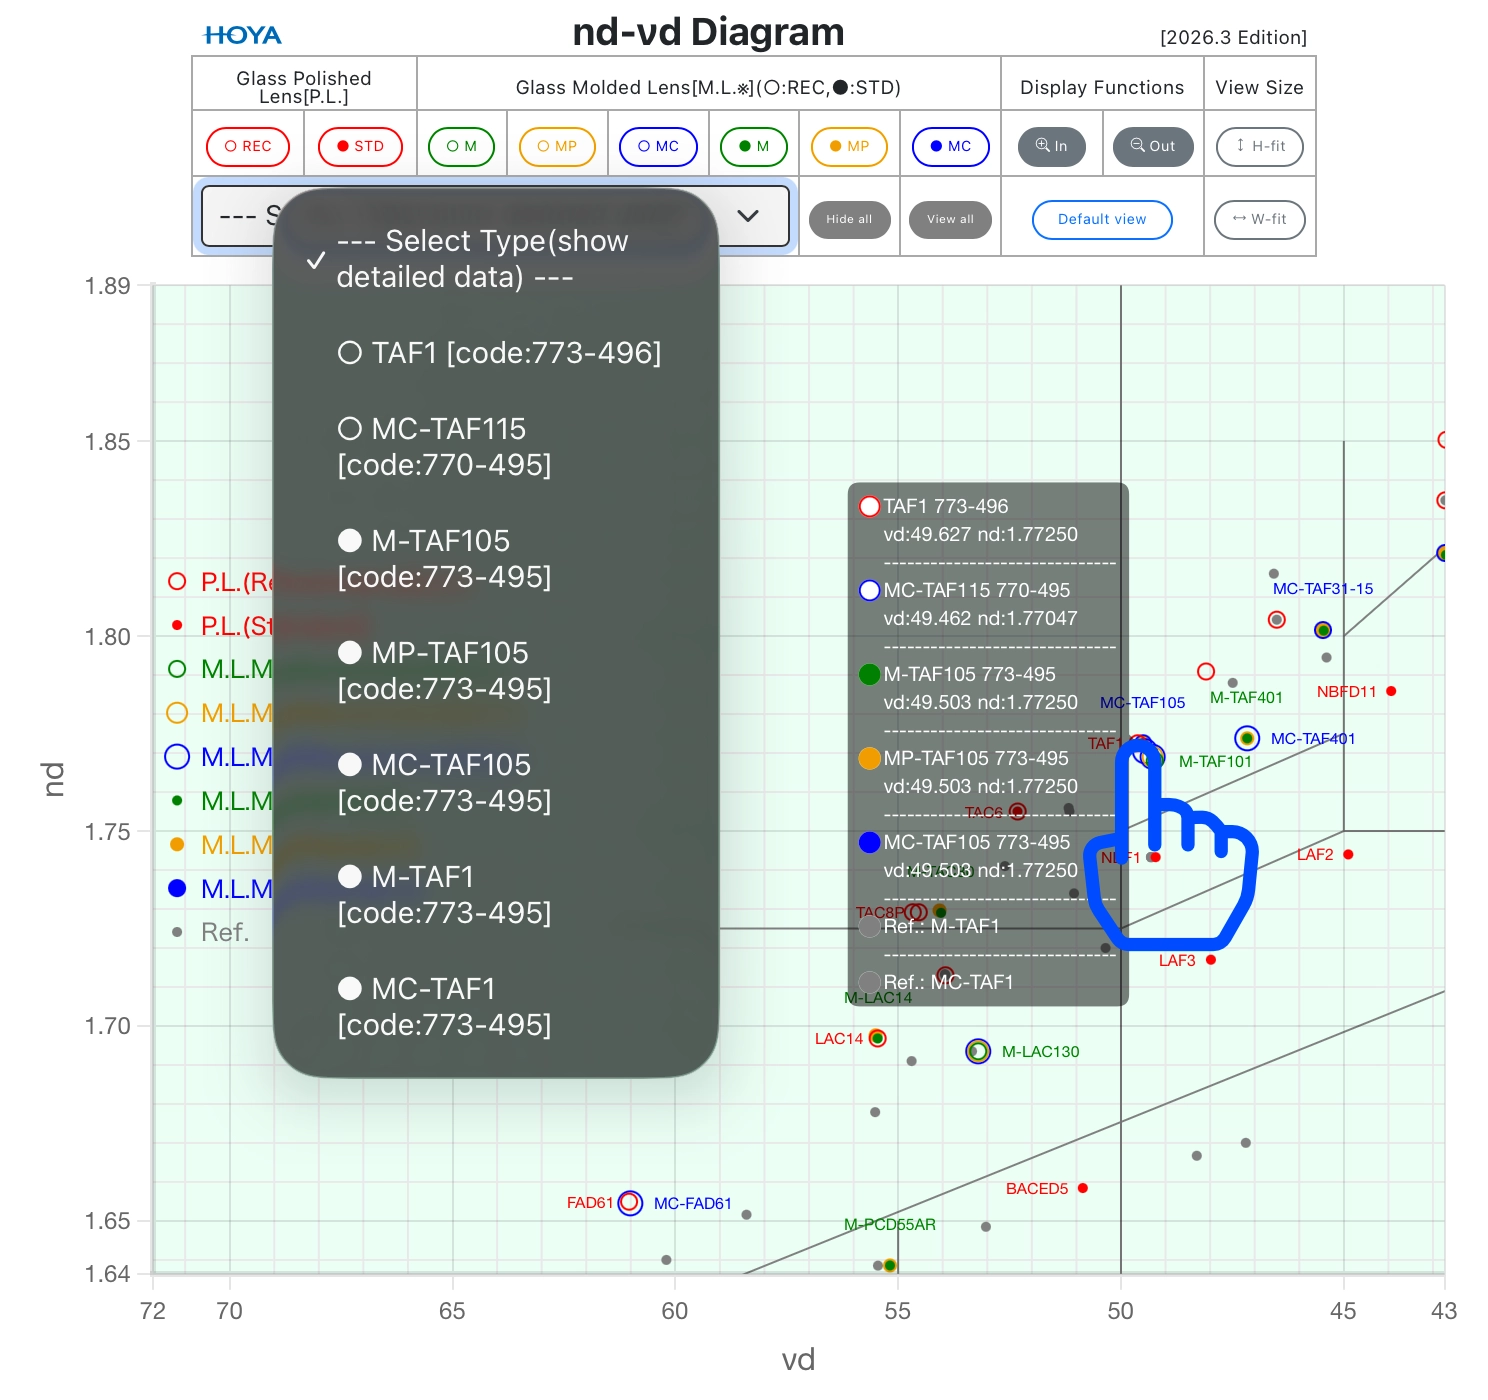
Clicking on a point or point cloud will appear a tooltip showing information such as the legend point, glass type, code number and coordinate values. Fig.9 shows an example of a tooltip where information about four different glass types with coordinates close to the clicked point is appeared.
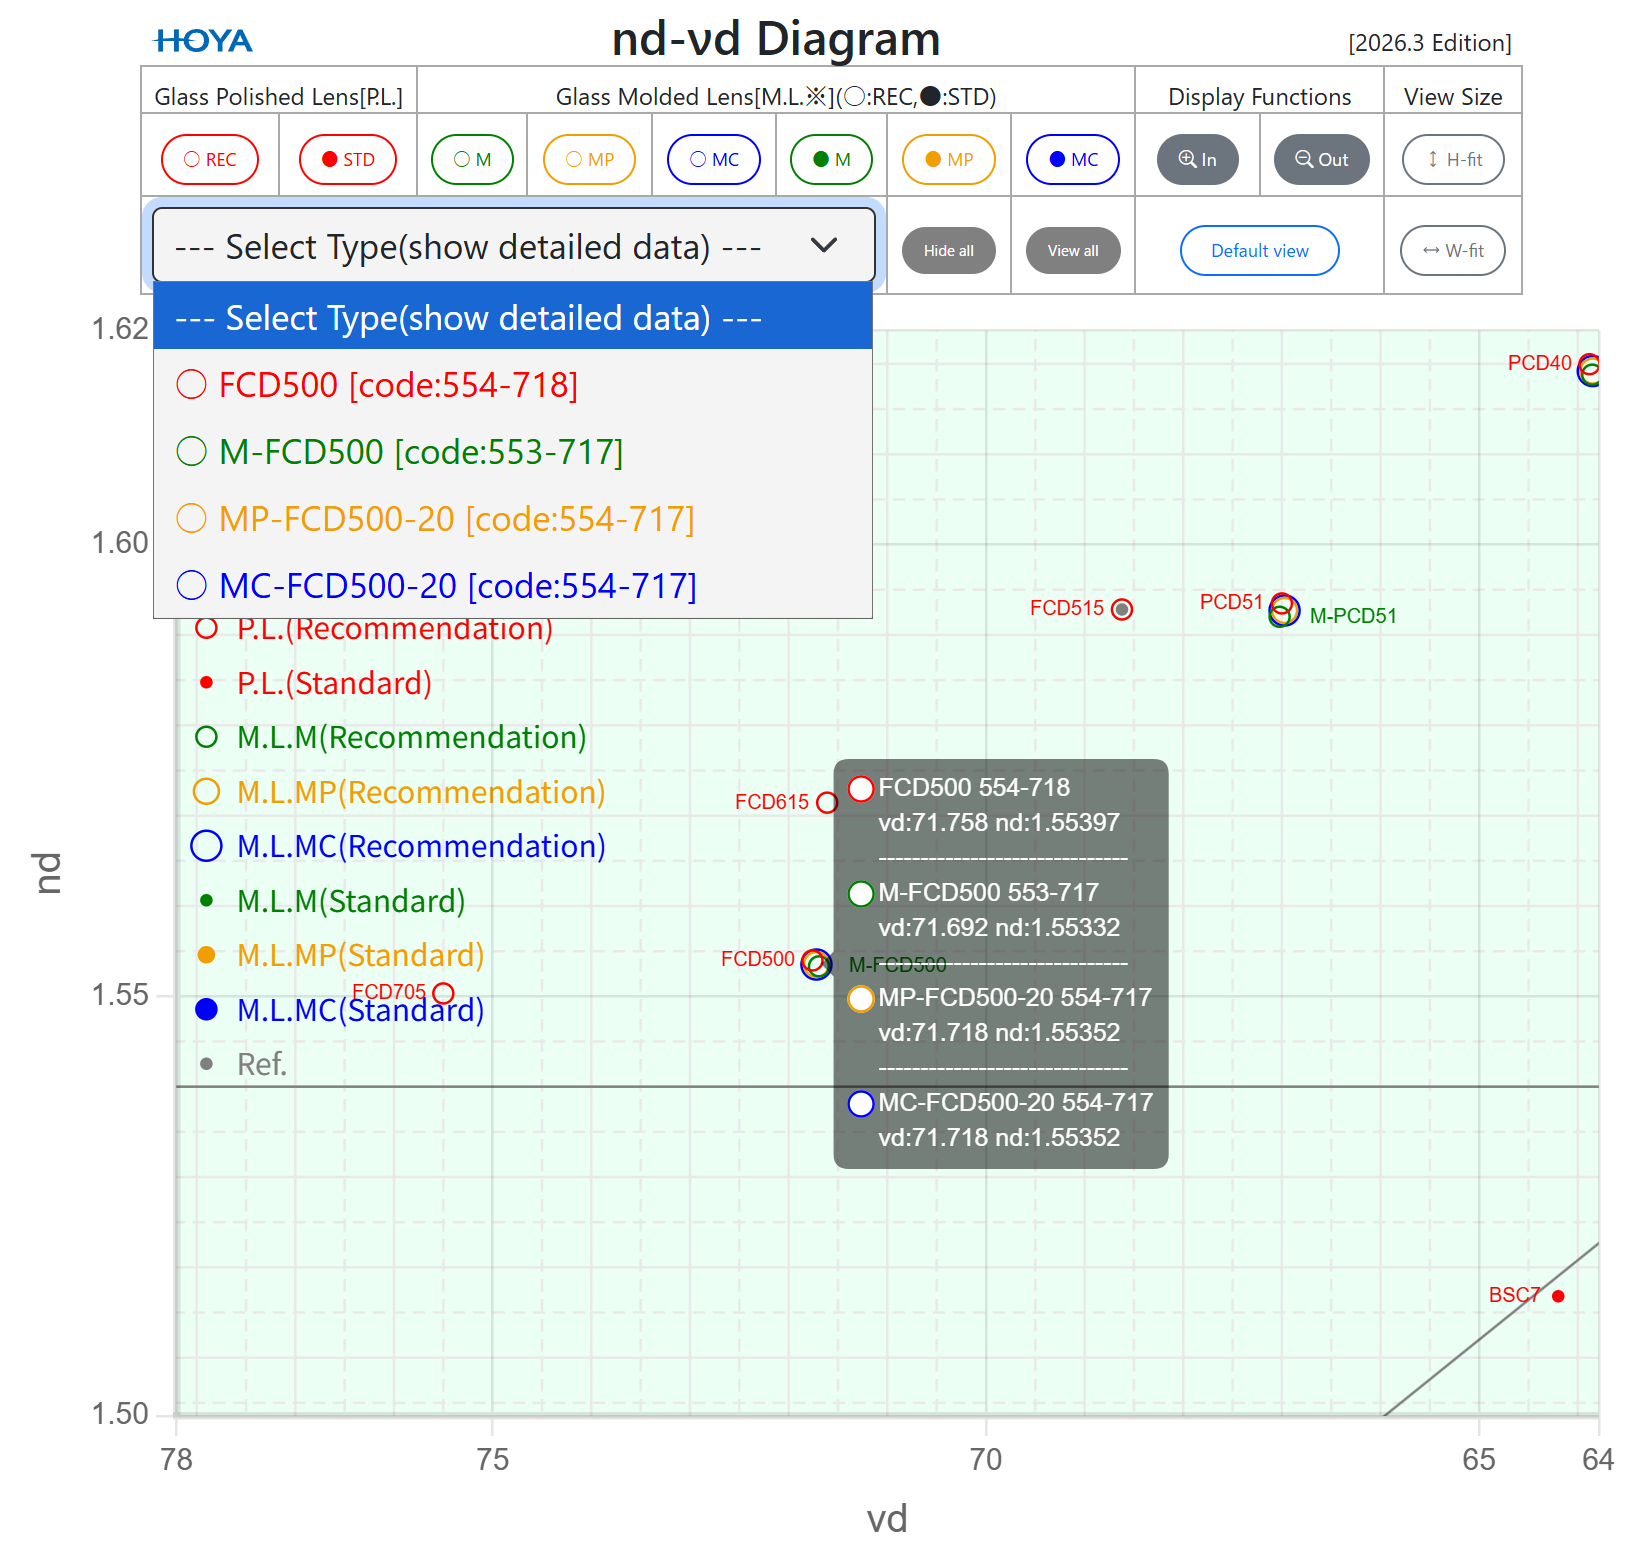
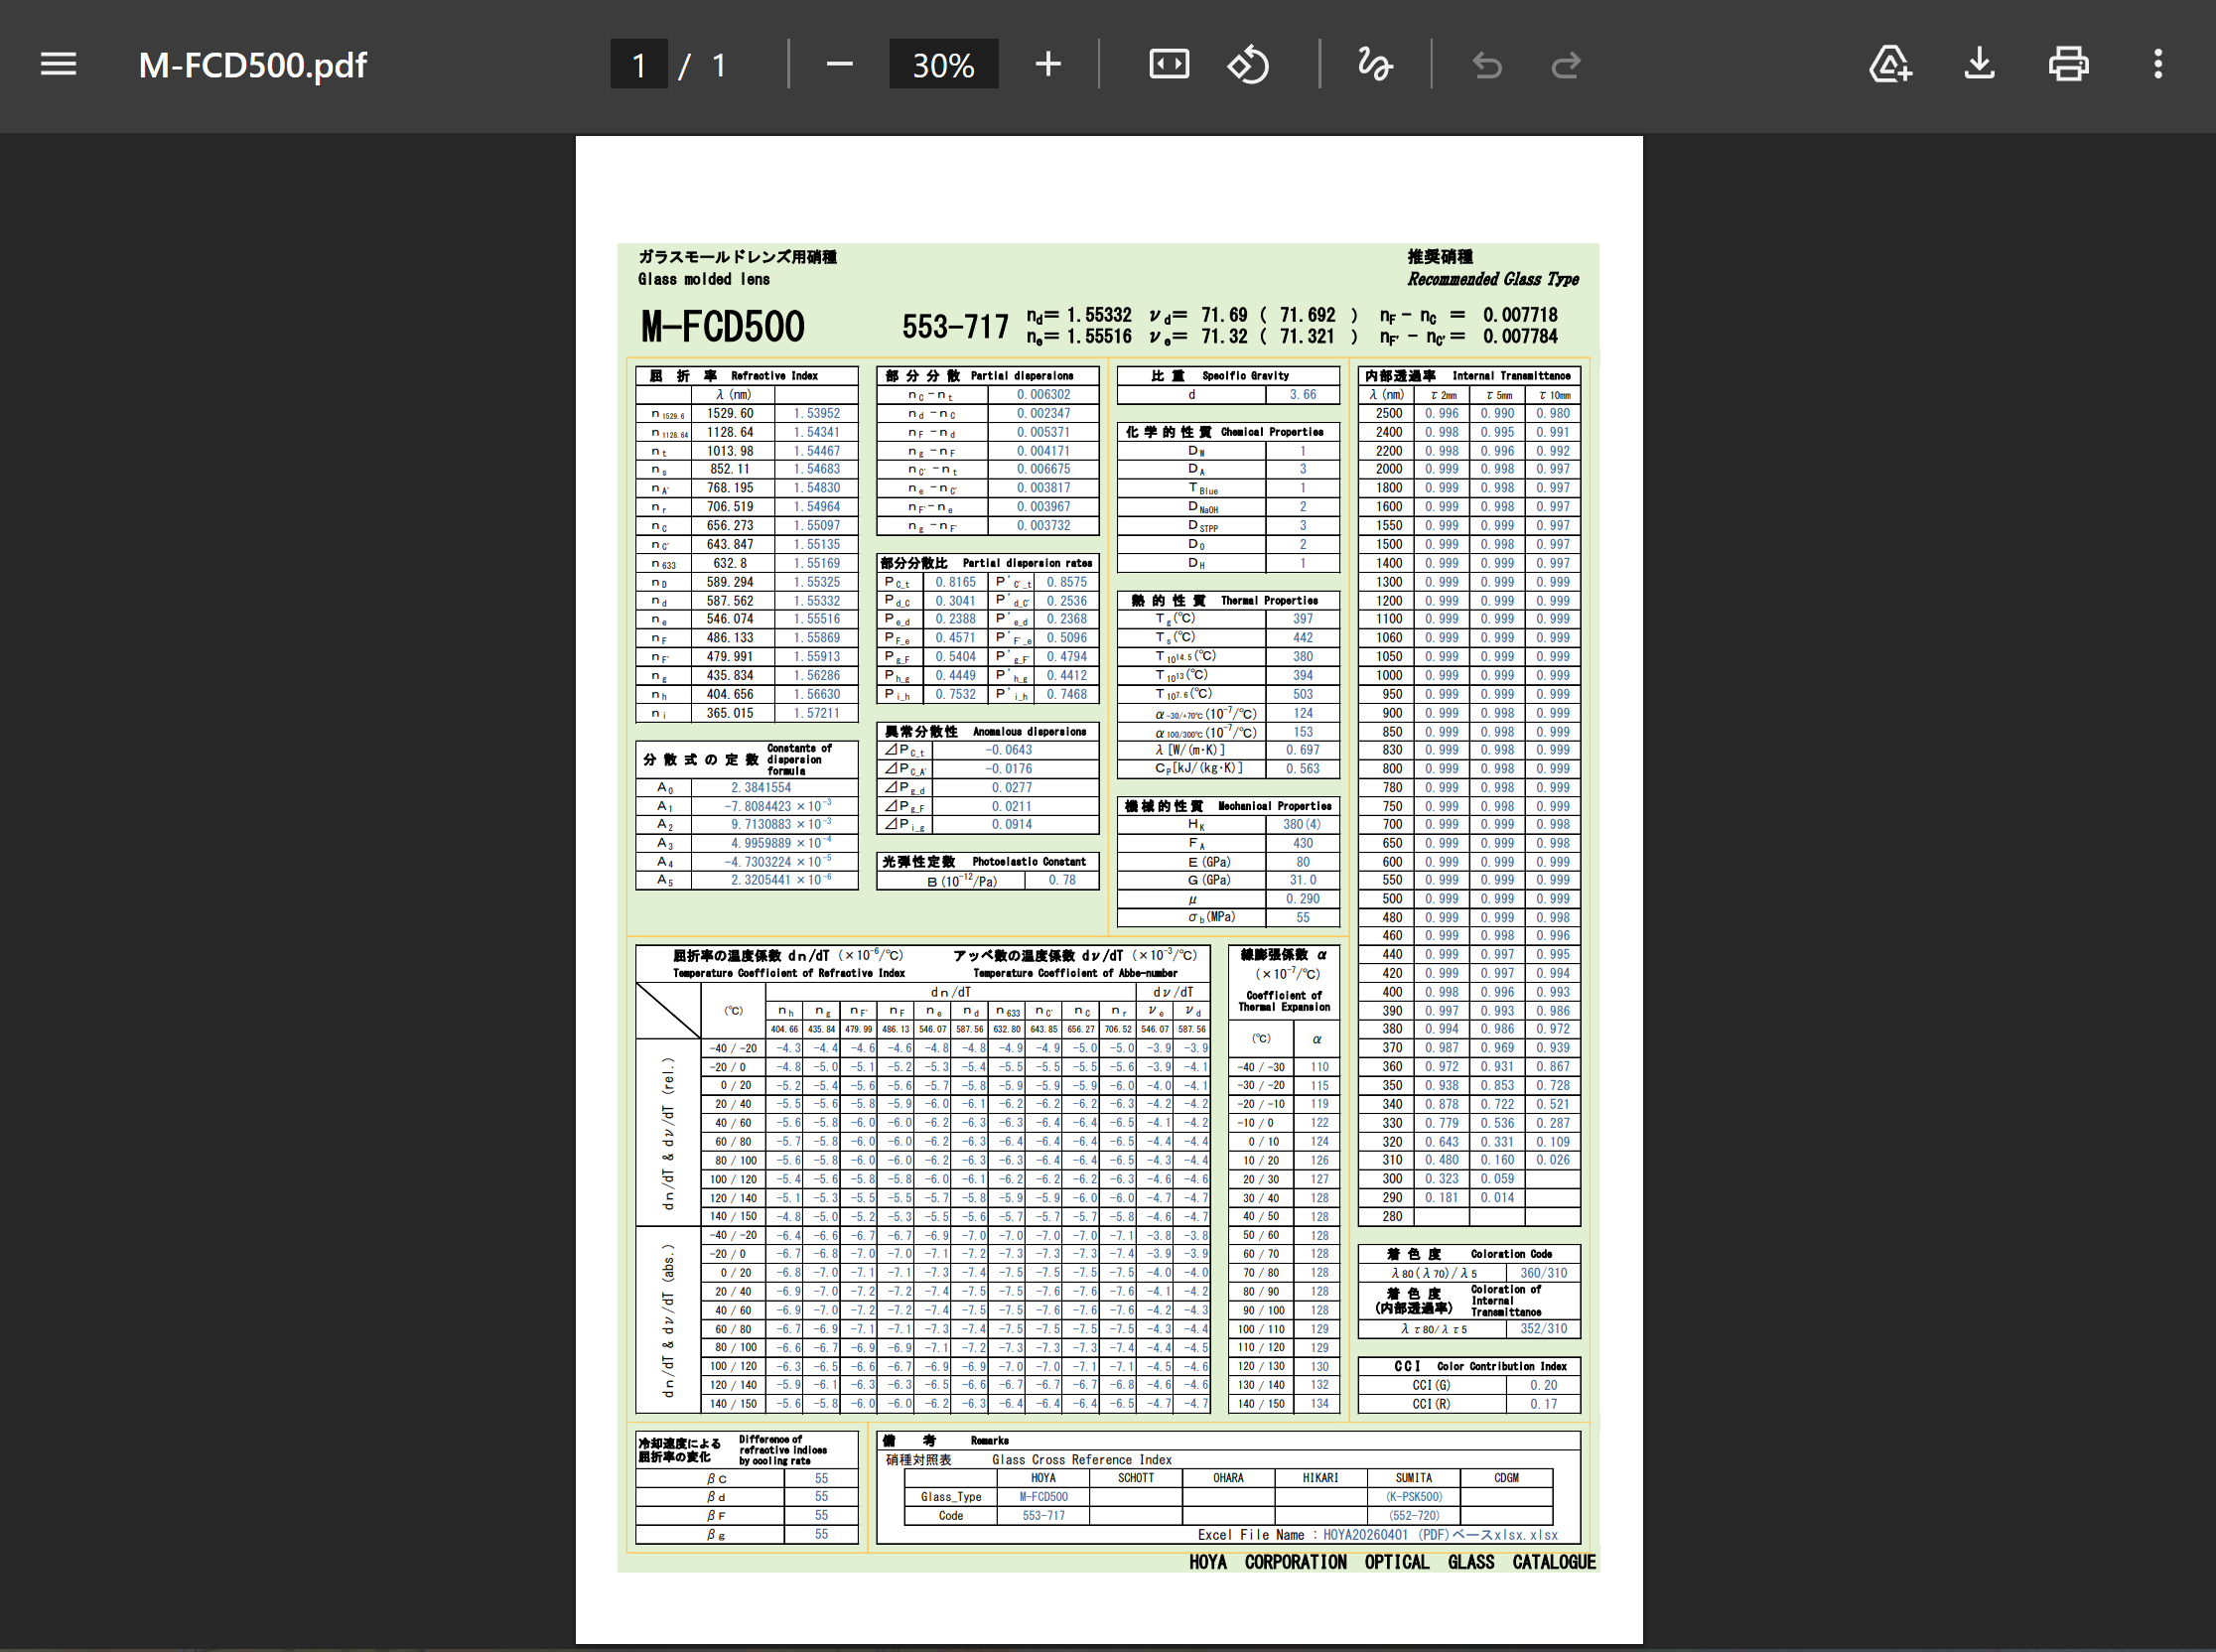
Furthermore, detailed data on these glass types can be seen as PDF, respectively. The glass types displayed in the tooltip are listed in “Select Type” of the command table section as shown in Fig.10. And clicking on the glass type for which you want to see detailed data will show a PDF in a separate browser tab (See Fig.11 that M-FCD500 was clicked).
*) Depending on the selected glass type(s), the size of “Select Type” may be automatically adjusted, which may result in a change in the overall size of the command table section.
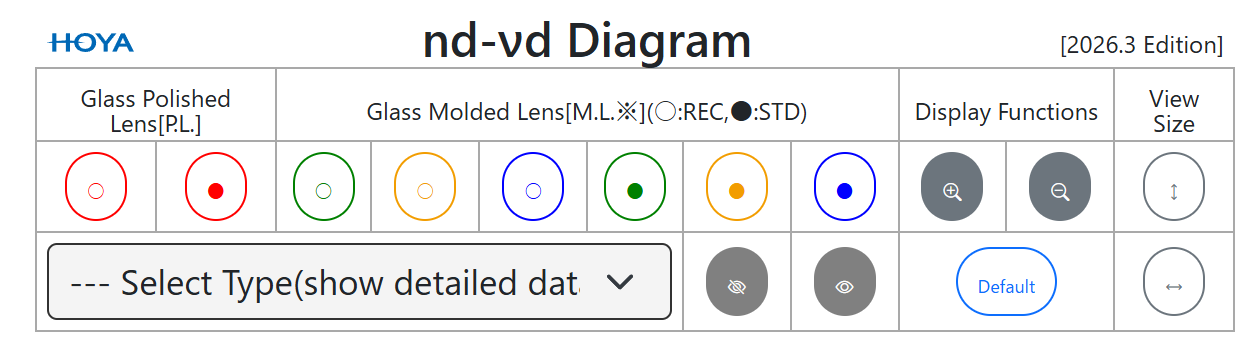
This is a table summarizing the operation commands for the diagram section. The size and contents (i.e., commands) of the table will vary depending on the device's resolution and the size of the browser's rendering area as shown in Fig.12 and 13.
The command locations for both remain unchanged, so use them accordingly.
(low resolution, e.g., tablet or smartphone)
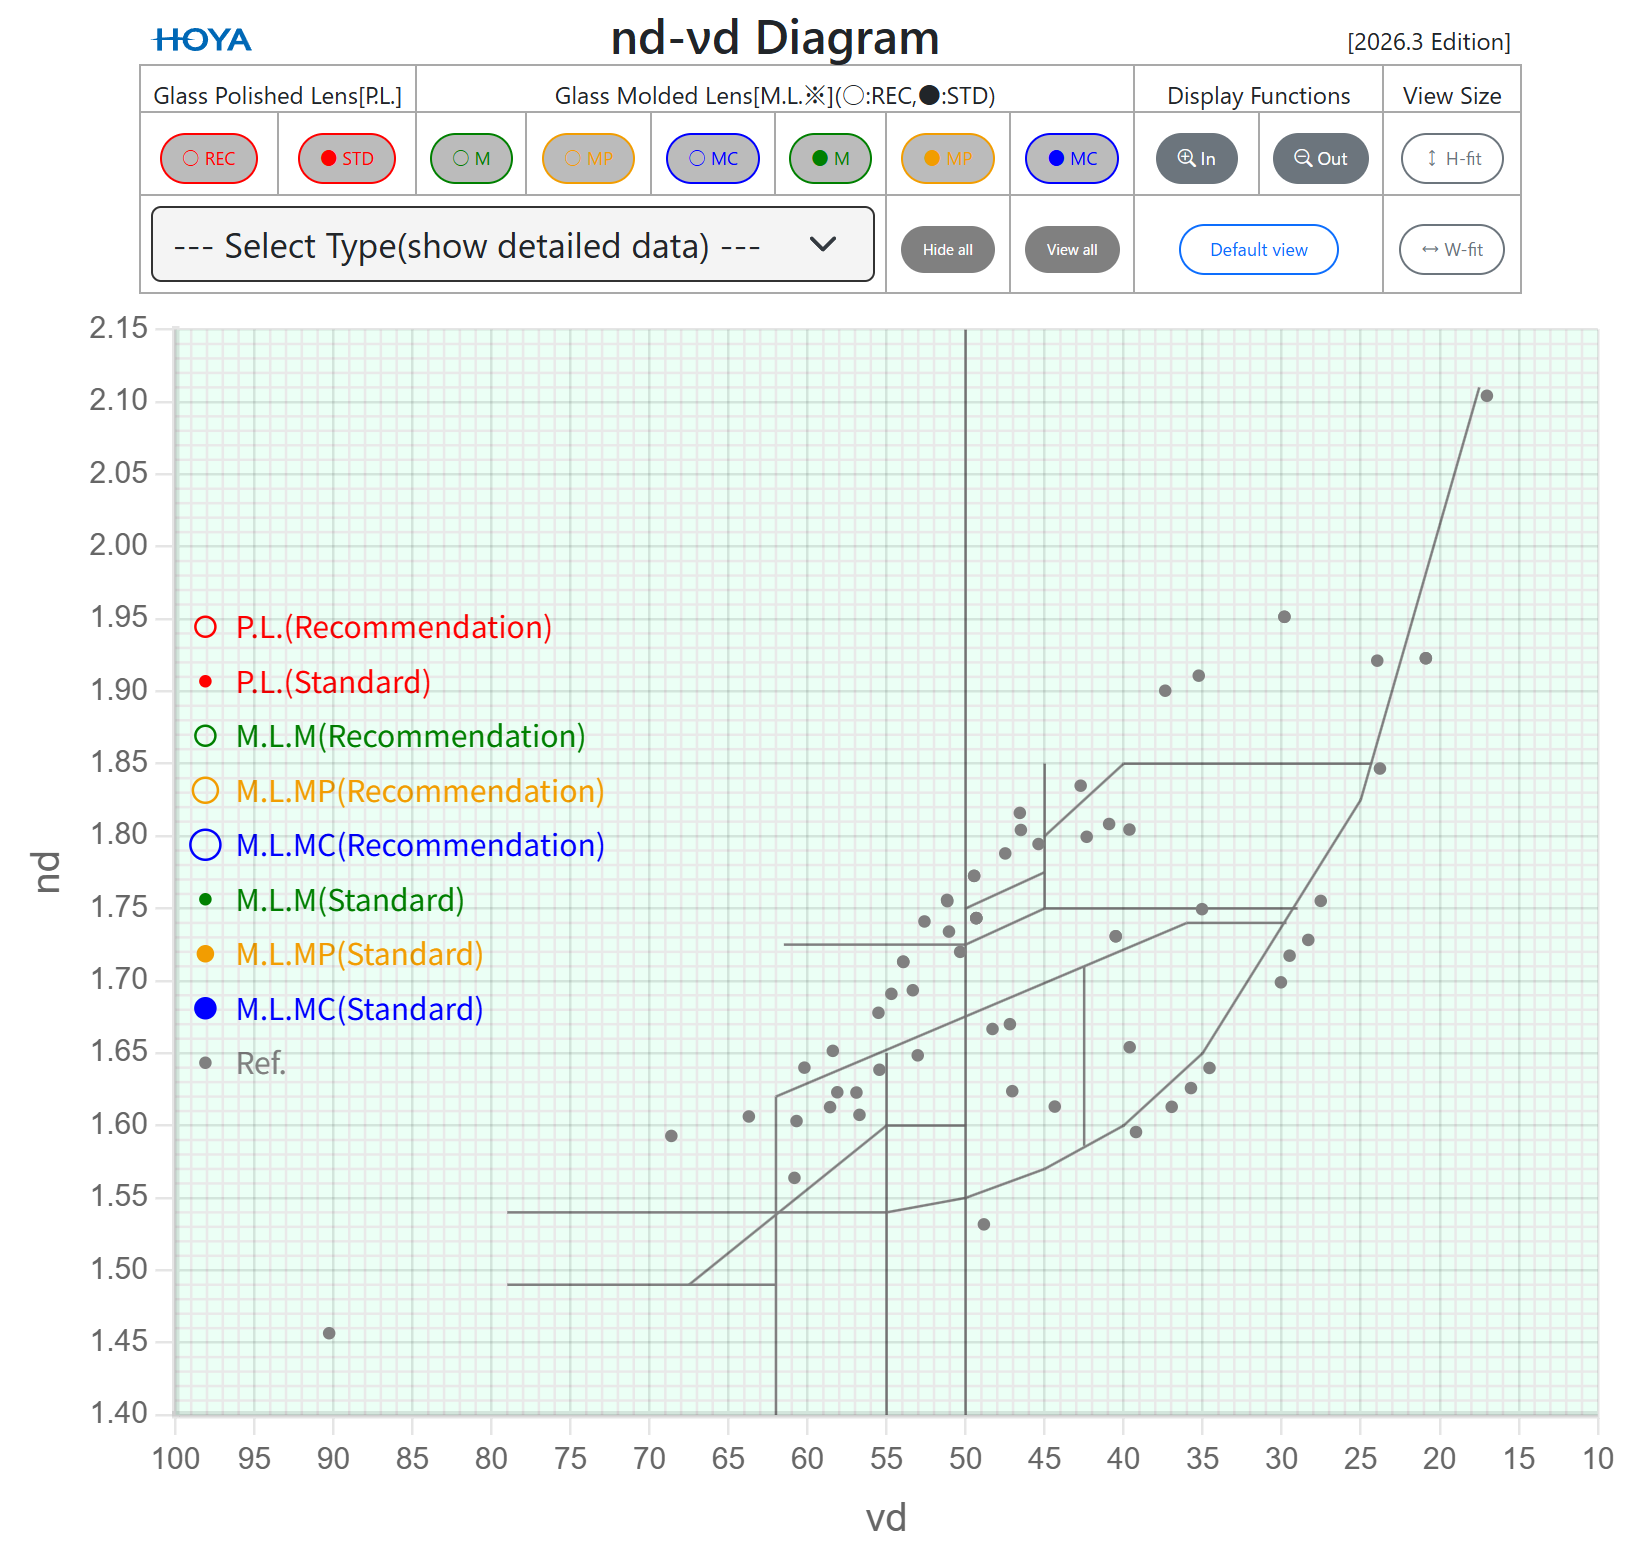
In the diagram section, you can view (default)/hide the polished lenses (P.L.) and molded lenses (M.L.*) by glass types. Recommended glass types are indicated with ○ and standard ones with ● (Fig.14).

Fig.15 shows an example where all P.L. are hidden from the diagram section. The command buttons for this function are toggle buttons, and when the background is gray, it indicates that the glass types are hidden. Clicking those buttons again will display the P.L. as shown in Fig.3.
In addition, commands to hide/view all glass types has been implemented.
 : Hide all glass types
(excluding the Ref. glass type and the gray lines separating glass types)
 : View all glass types
When you invoke “Hide all”, the result will be as shown in Fig.16, that is, all glass types are hidden from the diagram section and all command buttons of the glass types will become a gray background.
This function makes it convenient to display only the glass type(s) you want to see.
Conversely, if you want to display all glass types in the diagram section as shown in Fig.3, simply click “View all”.
These command buttons zoom in/out of the diagram section, similar to using the mouse wheel.
 : Zoom in
 : Zoom out
Clicking the button of “In” enlarges the diagram by 1.1x and clicking the button of “Out” becomes it by 0.8x.
By clicking “Default view”, you can return the enlarged or moved diagram (Fig.4 and Fig.8) to its default condition (Fig.3).
 : Default view
As shown in Fig.17, the startup characteristic diagram (the command table section and the diagram section) is displayed so that it fits within the height of the browser's rendering area (* the minimum size of the diagram section is set to a fixed value).
However, when the device's resolution is low, the diagram section becomes smaller, which may make it difficult to see and operate.
Therefore, “W-fit” is provided as a function to enlarge the size of the diagram section based on the width of the browser's rendering area. Therefore, the bottom of the diagram section may be cut off depending on the device's resolution (See Fig.18), but you can still view and operate it by scrolling the browser's rendering area. To display the characteristic diagram at its default size, click “H-fit” command.
 : Size adjustment based on height of browser’s rendering area (i.e., default size)
 : Size adjustment based on width of browser’s rendering area
The characteristic diagram can be printed using a printer or a PDF (software with printing capabilities is required such as Adobe Acrobat). Use the browser's print function to print.
Fig.19 shows an example of displaying the characteristic diagram (i.e., nd-νd diagram) on a tablet (Apple iPad mini 7 [high resolution] and Google Chrome for iPad), so the diagram section looks almost the same as a personal computer. Although there are some slight differences in how to operate it in the diagram section though the operation methods in command table section are same.
Furthermore, due to browser pop-up restrictions, the detailed glass type data (PDF) may not open in a separate tab. In that case, add this site to your browser's allowed pop-up list.
*) In particular, note that browsers other than Google Chrome (e.g., Firefox and Safari) have stricter restrictions on pop-ups and powerful caching functions (due to caching, stored old information may be displayed even after the web site has been updated).
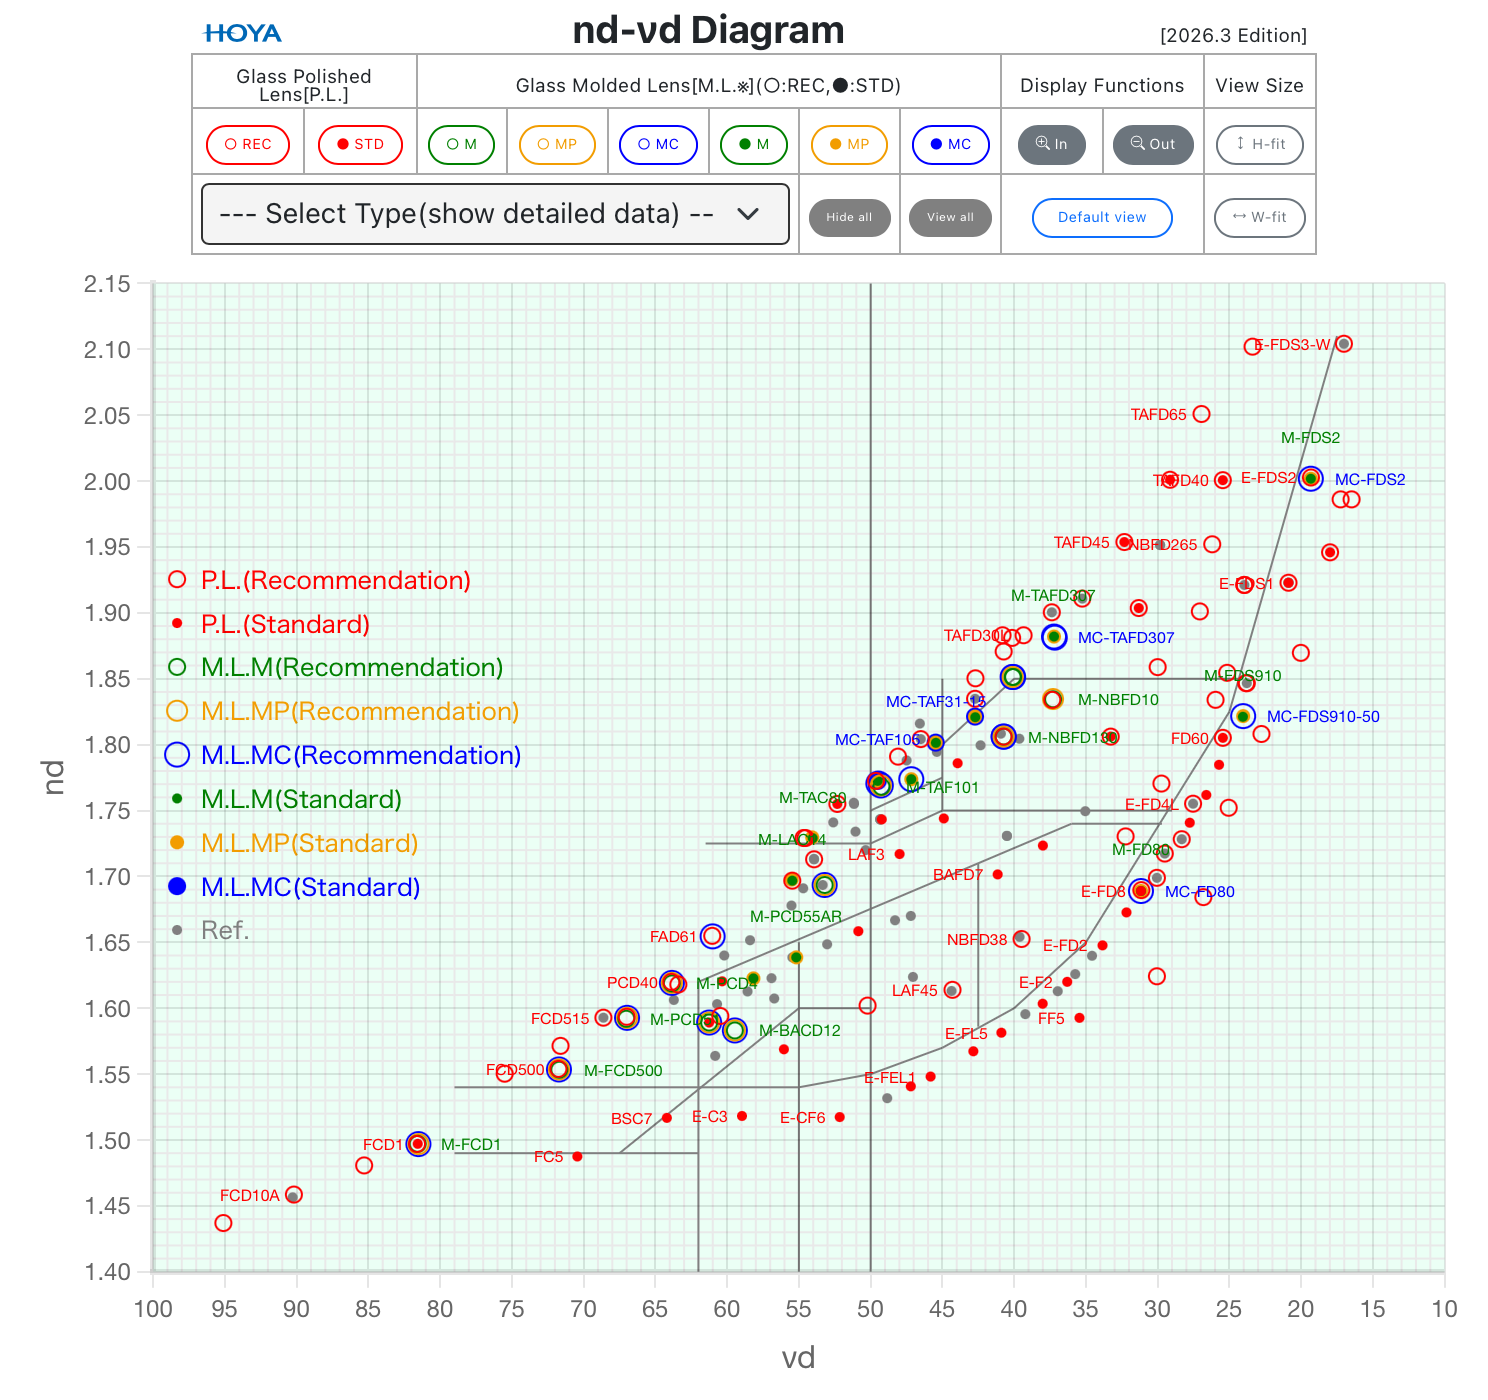
Diagram operation on mobile devices is done using pinch gestures with one or two fingers.
You can zoom in (Fig.20) and out (Fig.21) of the diagram section by pinching with two fingers.
Fig.20 and 21 show a pinch operation performed in the 2 and 8 o'clock direction, but the same result can be achieved by performing it in the 4 and 10 o'clock direction.
Vertical and horizontal axes zooming can be performed using pinch gestures as shown in Fig.22 and 23, respectively.
When place one finger on the diagram section and move it, the diagram will move along with it (Fig.24).
Tapping on a glass type(s) in the diagram will display a tooltip, and simultaneously, the glass type(s) and code number(s) will be listed in the “Select Type” of the command table section (* due to limitations of OS and browser for mobile device, color coding is not available). And clicking on the glass type for which you want to see detailed data will display a PDF (Fig.25).
Note that pinching outside the characteristic diagram in browser's rendering area will change the size of the characteristic diagram itself (* due to the mechanism of mobile devices) (Fig.26).
Printing the characteristic diagram from tablets or smartphones is not recommended.
If necessary, use the browser's print function.
The copyright for these diagrams and this manual belongs to the HOYA Group Optics Division.
Unauthorized linking, reproduction and reverse engineering of this site are prohibited.
Microsoft Windows and Edge are registerd trademarks of Microsoft Corporation.
Google Chrome is a registered trademark of Google LLC.
macOS and iPad are registered trademarks of Apple Inc.
All other trademarks are the property of their respective owners.